Konica Minolta 2004 Annual Report Download - page 46
Download and view the complete annual report
Please find page 46 of the 2004 Konica Minolta annual report below. You can navigate through the pages in the report by either clicking on the pages listed below, or by using the keyword search tool below to find specific information within the annual report.-
 1
1 -
2
-
3
-
4
-
5
-
6
-
7
-
8
-
9
-
10
-
11
-
12
-
13
-
14
-
15
-
16
-
17
-
18
-
19
-
20
-
21
-
22
-
23
-
24
-
25
-
26
-
27
-
28
-
29
-
30
-
31
-
32
-
33
-
34
-
35
-
 36
36 -
 37
37 -
 38
38 -
 39
39 -
 40
40 -
 41
41 -
 42
42 -
 43
43 -
 44
44 -
 45
45 -
 46
46 -
 47
47 -
 48
48 -
 49
49 -
 50
50 -
 51
51 -
 52
52 -
 53
53 -
 54
54 -
 55
55 -
 56
56 -
57
-
58
-
59
-
60
-
61
-
62
 |
 |

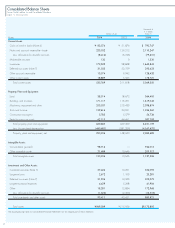
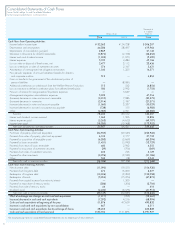
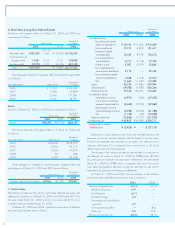
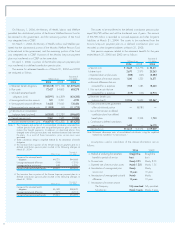
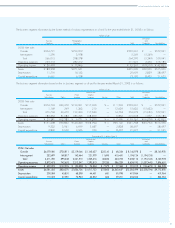
Consolidated Statements of Cash Flows
44
Konica Minolta Holdings, Inc. and Consolidated Subsidiaries
For the fiscal years ended March 31, 2004 and 2003
Thousands of
U.S. dollars
Millions of yen (Note 3)
2004 2003 2004
Cash Flows from Operating Activities:
Income before income taxes ¥32,363 ¥ 24,728 $ 306,207
Depreciation and amortization 44,386 28,497 419,964
Depreciation of consolidation goodwill 2,869 —27,145
Decrease in allowance for doubtful receivables (3,874) (2,163) (36,654)
Interest and cash dividend income (1,003) (1,051) (9,490)
Interest expenses 5,190 4,484 49,106
Loss on sales or disposal of fixed assets, net 2,477 3,112 23,436
Loss on write-down or sales of investment securities 574 2,167 5,431
Amortization of unrecognized net obligation at transition 1,540 1,325 14,571
Prior periods’ expenses of accrued retirement benefits for directors
and corporate auditors 513 —4,854
Gain on transfer to the government of the substitutional portion of
pension liabilities —(8,081) —
Additional contribution on withdrawals from the Welfare Pension Fund plans 513 543 (4,854)
Loss on transition to defined contribution plans from defined benefit plans 180 2,993 (1,703)
Provision of reserve for reorganization/liquidation expenses —5,637 —
Management integration rationalization expenses 5,022 —47,516
(Increase) decrease in notes and accounts receivable (3,210) 7,686 (30,372)
(Increase) decrease in inventories (2,914) 2,187 (27,571)
Increase (decrease) in notes and accounts payable (1,060) 3,337 (10,029)
Increase (decrease) in accrued consumption tax payable (738) 155 (6,983)
Other (4,585) 4,991 (43,382)
Subtotal 78,243 80,552 740,307
Interest and dividend income received 1,363 1,506 12,896
Interest expenses paid (5,263) (4,653) (49,797)
Income taxes paid (18,385) (10,968) (173,952)
Net cash provided by operating activities 55,957 66,437 529,445
Cash Flows from Investing Activities:
Purchases of property, plant and equipment (24,935) (29,545) (235,926)
Proceeds from sales of property, plant and equipment 6,102 2,177 57,735
Payment for acquisition of intangible assets (6,383) (3,669) (60,394)
Payment for loans receivable (1,451) (5,743) (13,729)
Proceeds from return of loans receivable 460 2,963 4,352
Payment for acquisition of investment securities (39) (706) (369)
Proceeds from sales of investment securities 225 746 2,129
Payment for other investments (3,296) (3,533) (31,186)
Other 533 (18) 5,043
Net cash used in investing activities (28,784) (37,328) (272,344)
Cash Flows from Financing Activities:
Net short-term debt (11,090) (19,551) (104,930)
Proceeds from long-term debt 674 16,000 6,377
Redemption of long-term debt (13,006) (3,300) (123,058)
Redemption of bonds (5,054) (15,354) (47,819)
Proceeds from capital increase from minority interest —1,300 —
Payment for repurchase of treasury stocks (286) (204) (2,706)
Proceeds from sale of treasury stocks 44 —416
Dividends paid (4,430) (3,576) (41,915)
Net cash used in financing activities (33,149) (24,685) (313,644)
Effect of exchange rate changes on cash and cash equivalents (1,317) (206) (12,461)
Increase (decrease) in cash and cash equivalents (7,292) 4,216 (68,994)
Cash and cash equivalents at beginning of the year 51,876 47,659 490,832
Increase in cash and cash equivalents by new consolidation 667 —6,311
Increase in cash and cash equivalents due to exchange of shares 38,453 —363,828
Cash and cash equivalents at fiscal year-end ¥ 83,704 ¥ 51,876 $ 791,977
The accompanying Notes to Consolidated Financial Statements are an integral part of these statements.