Konica Minolta 2004 Annual Report Download - page 50
Download and view the complete annual report
Please find page 50 of the 2004 Konica Minolta annual report below. You can navigate through the pages in the report by either clicking on the pages listed below, or by using the keyword search tool below to find specific information within the annual report.-
 1
1 -
2
-
3
-
4
-
5
-
6
-
7
-
8
-
9
-
10
-
11
-
12
-
13
-
14
-
15
-
16
-
17
-
18
-
19
-
20
-
21
-
22
-
23
-
24
-
25
-
26
-
27
-
28
-
29
-
30
-
31
-
32
-
33
-
34
-
35
-
36
-
37
-
38
-
39
-
 40
40 -
 41
41 -
 42
42 -
 43
43 -
 44
44 -
 45
45 -
 46
46 -
 47
47 -
 48
48 -
 49
49 -
 50
50 -
 51
51 -
 52
52 -
 53
53 -
 54
54 -
 55
55 -
 56
56 -
 57
57 -
 58
58 -
 59
59 -
 60
60 -
61
-
62
 |
 |

48
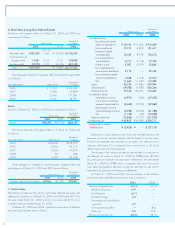
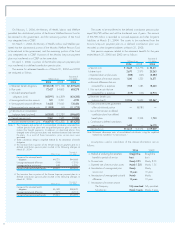
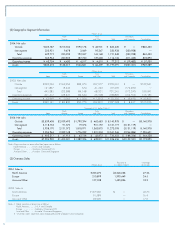
6. Short-Term & Long-Term Debt with Banks
Short-term and long-term debt as of March 31, 2004 and 2003 are
summarized as follows:
Thousands of
Millions of yen U.S. dollars
2004 2003 2004
(Interest rate)
Short-term debt ¥182,429 1.46 ¥ 90,592 $1,726,076
Current portion of
long-term debt 14,251 2.14 5,121 134,838
Long-term debt 32,778 1.29 24,126 310,133
Total ¥229,459 ¥119,840 $2,171,057
The repayment schedule of long-term debt from 2006 through 2009
is as follows:
Thousands of
Years ending March 31 Millions of yen U.S. dollars
2006 ¥ 7,054 $ 66,742
2007 5,908 55,899
2008 12,406 117,381
2009 2,005 18,971
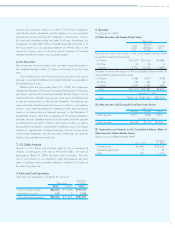
Bonds
Bonds as of March 31, 2004 and 2003 are summarized as follows:
Thousands of
Millions of yen U.S. dollars
2004 2003 2004
Bonds ¥38,492 ¥32,246 $364,197
The annual maturities of long-term debt as of March 31, 2004 are
as follows:
Thousands of
Years ending March 31 Millions of yen U.S. dollars
2005 ¥18,354 $173,659
2006 10,054 95,127
2007 5,054 47,819
2008 30 284
2009 5,000 47,308
Assets pledged as collateral for short-term debt, long-term debt and
guarantees as of March 31, 2004 and 2003 are as follows:
Thousands of
Millions of yen U.S. dollars
2004 2003 2004
Property, plant and equipment ¥3,044 ¥2,199 $28,801
7. Income Taxes
The statutory income tax rate used for calculating deferred tax assets and
deferred tax liabilities as of March 31, 2004 and 2003 were 40.7% for
the year ended March 31, 2004 and 42.1% (current) and 40.5% (non-
current) for the year ended March 31, 2003.
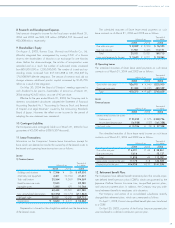
At March 31, 2004 and 2003, significant components of deferred
tax assets and liabilities were as follows:
Thousands of
Millions of yen U.S. dollars
2004 2003 2004
Gross deferred tax assets:
Excess of reserve for retirement
benefits over deductible limit
¥ 33,194 ¥15,046 $ 314,069
Net loss carried forward
19,174 4,820 181,417
Elimination of unrealized
intercompany profits
14,185 8,170 134,213
Excess of accrued bonuses
over deductible limit
6,101 2,718 57,725
Write-down on assets
5,587 6,970 52,862
Excess of depreciation and
amortization over deductible limit
3,712 —35,122
Excess of allowance for doubtful
accounts over deductible limit
1,608 1,418 15,214
Other
11,660 11,940 110,323
Subtotal
95,225 51,085 900,984
Valuation allowance
(19,483) (6,587) (184,341)
Deferred tax assets total
75,742 44,497 716,643
Gross deferred tax liabilities:
Unrealized gains on securities
(4,991) (540) (47,223)
Gains on securities contributed to
employees’ retirement benefit trust
(3,442) (3,592) (32,567)
Special tax-purpose reserve for
condensed booking of fixed assets
(3,296) (3,340) (31,186)
Other
(1,155) (43) (10,928)
Deferred tax liabilities total
(12,886) (7,517) (121,923)
Net deferred tax assets
¥ 62,855 ¥36,980 $ 594,711
Deferred tax liabilities related to
revaluation of land
¥ (3,925) ¥ —$ (37,137)
Deferred tax assets relating to net losses are recorded because the
Japanese accounting standard requires that the benefit of net loss carry-
forwards be estimated and recorded as an asset, with deduction of a
valuation allowance if it is expected that some portion or all of the
deferred tax assets will not be realized.
The change in the statutory income tax rate resulted in a reduction in
net deferred tax assets at March 31, 2004 by ¥788 million ($7,456
thousand) and an increase in income taxes—deferred for the year ended
March 31, 2004 by ¥788 million, compared with those that would
have been recognized if effective income tax rates 42.1% and 40.5%
had been fully applied to the temporary differences.
At March 31, 2004 and 2003, the reconciliation of the statutory
income tax rate to the effective income tax rate is as follows:
2004 2003
Statutory income tax rate 42.1% 42.1%
Valuation allowance 15.9 —
Tax Deduction (6.1) —
Tax Rate Change 2.4 —
Amortization of consolidation
goodwill 3.7 —
Unrecognized tax effect —(8.5)
Other, net 2.6 (0.5)
Effective income tax rate 60.6% 33.1%