Konica Minolta 2004 Annual Report Download - page 41
Download and view the complete annual report
Please find page 41 of the 2004 Konica Minolta annual report below. You can navigate through the pages in the report by either clicking on the pages listed below, or by using the keyword search tool below to find specific information within the annual report.-
 1
1 -
2
-
3
-
4
-
5
-
6
-
7
-
8
-
9
-
10
-
11
-
12
-
13
-
14
-
15
-
16
-
17
-
18
-
19
-
20
-
21
-
22
-
23
-
24
-
25
-
26
-
27
-
28
-
29
-
30
-
 31
31 -
 32
32 -
 33
33 -
 34
34 -
 35
35 -
 36
36 -
 37
37 -
 38
38 -
 39
39 -
 40
40 -
 41
41 -
 42
42 -
 43
43 -
 44
44 -
 45
45 -
 46
46 -
 47
47 -
 48
48 -
 49
49 -
 50
50 -
 51
51 -
52
-
53
-
54
-
55
-
56
-
57
-
58
-
59
-
60
-
61
-
62
 |
 |

39
KONICA MINOLTA HOLDINGS, INC. 2004
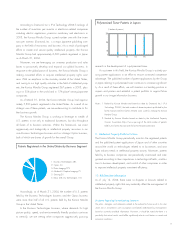
Billions of yen
Impact of
Foreign Currency Integration
Exchange Rates Expenses
Business Technologies +8.5 –4.1
Optics –0.8 –0.2
Photo Imaging +1.8 –0.5
Medical & Graphic Imaging –0.6 –0.2
Sensing –0.1 –0.1
Other Businesses 0.0 –3.7
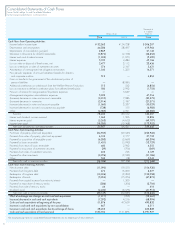
Cash Flows
In the fiscal year ended March 31, 2004, net cash provided by
operating activities totaled ¥86.1 billion, while net cash used in
investing activities, primarily for capital expenditure, was ¥31.9
billion. As a result, free-cash flows for the fiscal year ended
March 31, 2004 totaled ¥54.2 billion.
A portion of these funds were used to repay certain borrow-
ings and corporate bonds. Interest-bearing debt as of March 31,
2004 totaled at ¥268 billion, while the debt-to-equity ratio fell
from 0.84 to 0.80. Net cash used in financing activities in the
fiscal year ended March 31, 2004 was ¥55.3 billion.
After considering the cash flows from operating, investing,
and financing activities and the ¥1.6 billon decrease for the
effect of exchange rate changes, cash and cash equivalents at
March 31, 2004 declined ¥2.7 billion as compared to March
31, 2003. Due to the integration with Minolta Co., Ltd. and
new subsidiaries included in the Company’s scope of consolida-
tion, cash and cash equivalents increased by ¥33.5 billion and
¥1.0 billion, respectively. As a result, the balance of cash and
cash equivalents at March 31, 2004 was ¥83.7 billion.
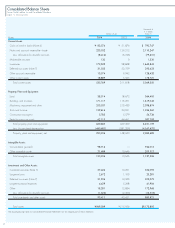
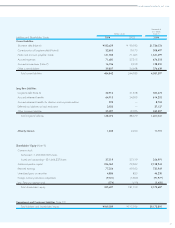
Assets, Liabilities, and Equity
As of March 31, 2004, total assets were ¥969.6 billion and
included current assets of ¥535.8 billion and fixed assets of
¥433.8 billion.
The principal components of current assets were notes and
accounts receivable—trade of ¥223.0 billion, inventories of
¥173.9 billion, and cash and cash equivalents of ¥83.6 billion
before adding ¥0.1 billion of marketable securities.
The significant components in fixed assets at March 31,
2004 included property, plant and equipment, consolidation
goodwill, investment securities and noncurrent deferred tax assets
of ¥220.2 billion, ¥98.7 billion, ¥37.4 billion, and ¥31.9 bil-
lion, respectively. The consolidation goodwill account is being
amortized on a straight-line basis over 5 to 20 years.
Amortization expense of the consolidation goodwill amount in
the fiscal year ended March 31, 2004 was ¥2.4 billion.
As of March 31, 2004, total liabilities were ¥632.9 billion
and included current liabilities of ¥484.8 billion and long-term
liabilities of ¥148.1 billion. The balance of liabilities, as of
March 31, 2004, was impacted by repayments of interest-
bearing debt through free-cash flows generated for the period.
Current liabilities comprised mainly short-term debt, notes
and accounts payable—trade, and accrued expenses with bal-
ances of ¥182.4 billion, ¥141.8 billion, and ¥71.5 billion,
respectively. The principal components of long-term liabilities
included long-term debt of ¥52.9 billion and accrued retirement
benefits of ¥65.8 billion. Minority interests as of March 31,
2004 were ¥1.2 billion.
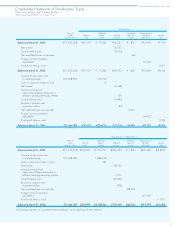
The primary components of shareholders’ equity at March
31, 2004 include common stock, additional paid-in capital,
and retained earnings, with balances of ¥37.5 billion, ¥226.1
billion and ¥77.3 billion, respectively. Additional shareholders’
equity components include unrealized gains on securities of
¥4.9 billion and foreign currency translation adjustments, which
reflect cumulative translation losses of ¥9.7 billion. The total
shareholders’ equity balance at the March 31, 2004 was
¥335.4 billion.
Driven by efforts to streamline assets, the equity ratio was
34.6%, while equity per share totaled ¥631.54.
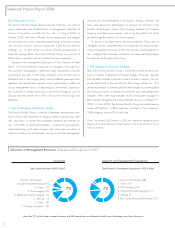
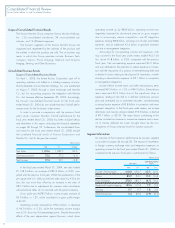
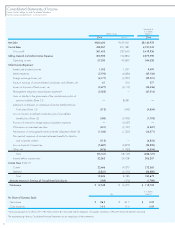
Capital Expenditures and Research and Development
Expenditures
During the fiscal year ended March 31, 2004, the Company
incurred capital expenditures totaling ¥43.1 billion with the aim
of developing new products, increasing production capacity,
implementing rationalization measures, and promoting labor effi-
ciency and power conservation. These expenditures by business
segment include ¥15.2 billion for Business Technologies, ¥6.3
billion for Optics, ¥9.9 billion for Photo Imaging, ¥4.5 billion for
Medical and Graphic Imaging, ¥0.1 billion for Sensing and
¥7.1 billion for all other business segments combined.
Research and development expenditure totaled ¥63.2 billion
during the fiscal year ended March 31, 2004 and included
¥29.6 billion for the Business Technologies segment, ¥7.0 bil-
lion for Optics, ¥9.7 billion for Photo Imaging, ¥7.7 billion for
Medical and Graphic Imaging, and ¥1.0 billion for Sensing.
Expenditures not allocated to a specific business segment, but
used for the development of basic research totaled ¥8.2 billion.
Outlook
The outlook for future economic conditions remains mixed. On
the one hand, an overall global economic recovery is antici-
pated, fueled by a noticeable surge in U.S. business conditions.
This positive scenario is in part offset by concerns over the situa-
tion in the Middle East, and particularly Iraq, and the continued
appreciation of the yen against the U.S. dollar. Against this back-
drop, we will accelerate the implementation of business integra-
tion measures and work to quickly realize the underlying benefits.