Konica Minolta 2004 Annual Report Download - page 16
Download and view the complete annual report
Please find page 16 of the 2004 Konica Minolta annual report below. You can navigate through the pages in the report by either clicking on the pages listed below, or by using the keyword search tool below to find specific information within the annual report.-
 1
1 -
2
-
3
-
4
-
5
-
 6
6 -
 7
7 -
 8
8 -
 9
9 -
 10
10 -
 11
11 -
 12
12 -
 13
13 -
 14
14 -
 15
15 -
 16
16 -
 17
17 -
 18
18 -
 19
19 -
 20
20 -
 21
21 -
 22
22 -
 23
23 -
 24
24 -
 25
25 -
 26
26 -
27
-
28
-
29
-
30
-
31
-
32
-
33
-
34
-
35
-
36
-
37
-
38
-
39
-
40
-
41
-
42
-
43
-
44
-
45
-
46
-
47
-
48
-
49
-
50
-
51
-
52
-
53
-
54
-
55
-
56
-
57
-
58
-
59
-
60
-
61
-
62
 |
 |
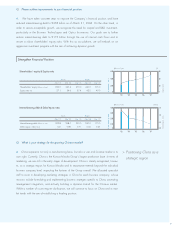
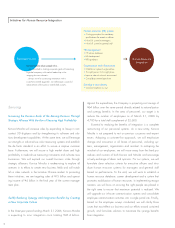
14
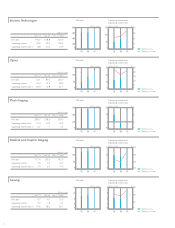
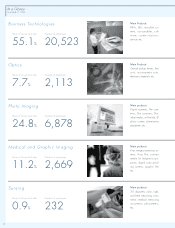
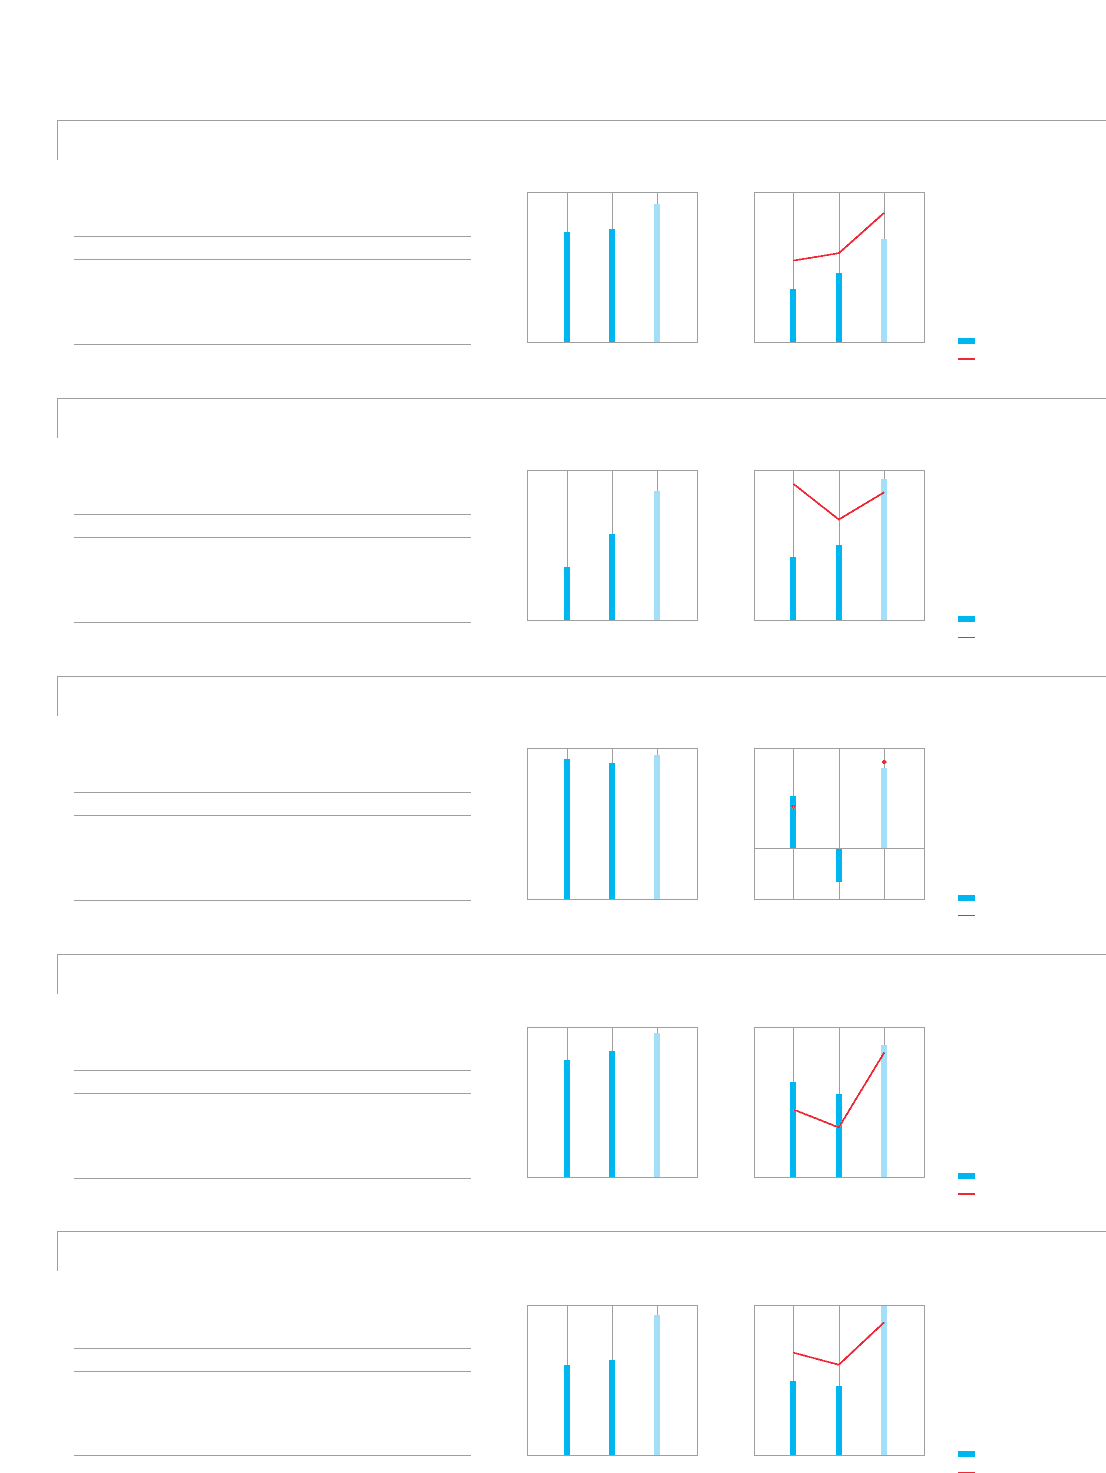
Business Technologies
Optics
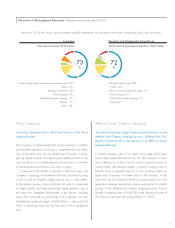
Photo Imaging
Medical and Graphic Imaging
Sensing
Net sales
Mar ’03 Mar ’04
117.4 125.6 145.0
9.3 7.9 13.0Operating income
7.9 6.3 9.0Operating income ratio (%)
(Billions of yen)
’03
150
100
50
0
’04 ’07
Net sales
Mar ’03 Mar ’04
280.7 278.2 290.0
10.4 (6.7) 16.0Operating income (loss)
3.7 — 5.5Operating income ratio (%)
(Billions of yen)
’03
300
200
100
0
’04 ’07
Net sales
Mar ’03 Mar ’04
9.7 9.7 15.0
2.0 1.8 4.0Operating income
20.6 18.6 26.7Operating income ratio (%)
(Billions of yen)
’03 ’04 ’07
16
12
8
4
0
Net sales
Mar ’03 Mar ’04
54.1 85.9 130.0
12.4 15.3 28.0Operating income
22.9 17.8 21.5Operating income ratio (%)
(Billions of yen)
’03
150
100
50
0
’04 ’07
Net sales
Mar ’03 Mar ’04 Mar ’07 Target
594.7 618.8 740.0
52.6 62.9 103.0Operating income
8.8 10.2 13.9Operating income ratio (%)
(Billions of yen)
’03
800
600
400
200
0
’04 ’07
Operating income
Operating income ratio
’03
15
10
5
0
9.5
8.5
7.5
6.5
’04 ’07
’03
6
4
2
0
’04 ’07
’03
30
20
10
0
’04 ’07
4
3
2
1
0
20
10
0
-10
’03
30
20
10
0
150
100
50
0
’04 ’07
25
20
15
10
5
0
(%)(Billions of yen)
(%)(Billions of yen)
(%)(Billions of yen)
(%)(Billions of yen)
(%)(Billions of yen)
’03
16
12
8
4
0
’04 ’07
(Billions of yen)
Mar ’07 Target
(Billions of yen)
Mar ’07 Target
(Billions of yen)
Mar ’07 Target
(Billions of yen)
Mar ’07 Target
(Billions of yen)
Net sales Operating income and
Operating income ratio
Operating income
Operating income ratio
Net sales Operating income and
Operating income ratio
Operating income
Operating income ratio
Net sales Operating income and
Operating income ratio
Operating income
Operating income ratio
Net sales Operating income and
Operating income ratio
Operating income
Operating income ratio
Net sales Operating income and
Operating income ratio