Konica Minolta 2004 Annual Report Download - page 49
Download and view the complete annual report
Please find page 49 of the 2004 Konica Minolta annual report below. You can navigate through the pages in the report by either clicking on the pages listed below, or by using the keyword search tool below to find specific information within the annual report.-
 1
1 -
2
-
3
-
4
-
5
-
6
-
7
-
8
-
9
-
10
-
11
-
12
-
13
-
14
-
15
-
16
-
17
-
18
-
19
-
20
-
21
-
22
-
23
-
24
-
25
-
26
-
27
-
28
-
29
-
30
-
31
-
32
-
33
-
34
-
35
-
36
-
37
-
38
-
 39
39 -
 40
40 -
 41
41 -
 42
42 -
 43
43 -
 44
44 -
 45
45 -
 46
46 -
 47
47 -
 48
48 -
 49
49 -
 50
50 -
 51
51 -
 52
52 -
 53
53 -
 54
54 -
 55
55 -
 56
56 -
 57
57 -
 58
58 -
 59
59 -
60
-
61
-
62
 |
 |

47
KONICA MINOLTA HOLDINGS, INC. 2004
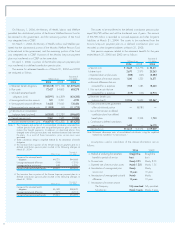
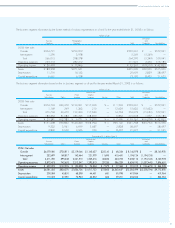
5. Securities
As of March 31, 2004
(1) Other Securities with Quoted Market Values
Millions of yen
Market value
Original at the con- Unrealized
purchase solidated balance gains or
value sheet date losses
Securities for which the amounts in the consolidated balance sheets
exceed the original purchase value
(1) Shares ¥15,679 ¥25,165 ¥9,485
(2) Other 22 26 4
Subtotal 15,702 25,192 9,489
Securities for which the amounts in the consolidated balance sheets do
not exceed the original purchase value
(1) Shares 5,685 5,007 (678)
(2) Other 186 181 (4)
Subtotal 5,872 5,189 (683)
Total ¥21,574 ¥30,381 ¥8,806
Thousands of U.S. dollars
Total $204,125 $287,454 $83,319
(2) Other Securities Sold During the Fiscal Year Under Review
Millions of yen
Sale value Total profit Total loss
Other securities ¥501 ¥228 ¥461
Thousands of U.S. dollars
Other securities $4,740 $2,157 $4,362
(3) Composition and Amounts on the Consolidated Balance Sheets of
Other Securities Without Market Quotes
Amounts on consolidated balance sheets
Thousands of
Millions of yen U.S. dollars
Unlisted stocks ¥1,443 $13,653
Unlisted foreign bonds 5 47
Other 130 1,230
directors and corporate auditors as a result of the business integration
with Minolta and its subsidiaries and the adoption of a new corporate
governance structure including the Companies’ compensation, nomina-
tion and audit committee during the current fiscal year. Accordingly, the
Companies recorded ¥409 million in benefits expected to be paid as of
the fiscal year-end as an operating expense and ¥513 million in the
amount for previous years as the prior periods’ expenses of accrued
retirement benefits for directors and corporate auditors.
(m) Per Share Data
Net income per share of common stock has been computed based on
the weighted-average number of shares outstanding during the fiscal
year.
Cash dividends per share shown for each fiscal year in the accom-
panying consolidated statements are dividends declared as applicable to
the respective fiscal years.
Effective from the year ended March 31, 2003, the Companies
adopted the Statement of Financial Accounting Standard No. 2 “Earnings
per Share” issued by the Accounting Standards Board of Japan. Prior to
adopting the new statement, earnings per share were calculated based
on the net income shown on the Income Statements. The earnings per
share calculation therefore excluded bonuses to directors and statutory
auditors, since under the Japanese Commercial Code, these are recog-
nized as an appropriation of retained earnings, in the Statements of
Shareholders’ Equity, rather than as expenses in the Income Statements.
However, the new statement requires that net income should be adjusted
by deducting bonuses paid to directors and statutory auditors, as well as
the payment of dividends to shareholders of preferred stocks to be recog-
nized as an appropriation of retained earnings, from net income shown
in the Income Statements, and the calculation of earnings per share be
made on that adjusted net income basis.
3. U.S. Dollar Amounts
Amounts in U.S. dollars are included solely for the convenience of
readers outside Japan. The rate of ¥105.69=US$1, the rate of
exchange on March 31, 2004, has been used in translation. The inclu-
sion of such amounts is not intended to imply that Japanese yen have
been or could be readily converted, realized or settled in U.S. dollars at
this rate or any other rate.
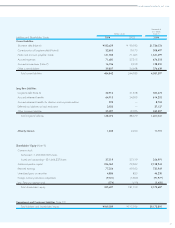
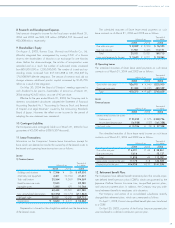
4. Cash and Cash Equivalents
Cash and cash equivalents as of March 31 consist of:
Thousands of
Millions of yen U.S. dollars
2004 2003 2004
Cash on hand in banks ¥83,574 ¥51,876 $790,747
Marketable securities 130 01,230
Cash and cash equivalents ¥83,704 ¥51,876 $791,977