Konica Minolta 2004 Annual Report Download - page 40
Download and view the complete annual report
Please find page 40 of the 2004 Konica Minolta annual report below. You can navigate through the pages in the report by either clicking on the pages listed below, or by using the keyword search tool below to find specific information within the annual report.-
 1
1 -
2
-
3
-
4
-
5
-
6
-
7
-
8
-
9
-
10
-
11
-
12
-
13
-
14
-
15
-
16
-
17
-
18
-
19
-
20
-
21
-
22
-
23
-
24
-
25
-
26
-
27
-
28
-
29
-
 30
30 -
 31
31 -
 32
32 -
 33
33 -
 34
34 -
 35
35 -
 36
36 -
 37
37 -
 38
38 -
 39
39 -
 40
40 -
 41
41 -
 42
42 -
 43
43 -
 44
44 -
 45
45 -
 46
46 -
 47
47 -
 48
48 -
 49
49 -
 50
50 -
51
-
52
-
53
-
54
-
55
-
56
-
57
-
58
-
59
-
60
-
61
-
62
 |
 |

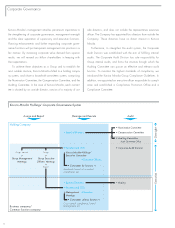
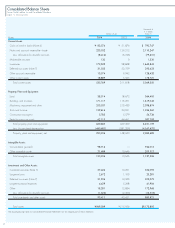
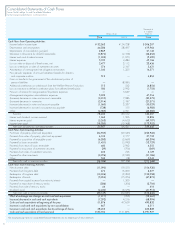
Consolidated Financial Review
38
Scope of Consolidated Financial Results
The Konica Minolta Group comprises Konica Minolta Holdings,
Inc., 122 consolidated subsidiaries, 34 unconsolidated sub-
sidiaries, and 12 affiliated companies.
The business segments of the Konica Minolta Group are
organized and segmented by the similarity of the products and
the markets in which the products are sold. The six business seg-
ments in which the Group operates include: Business Tech-
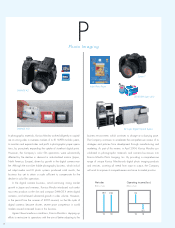
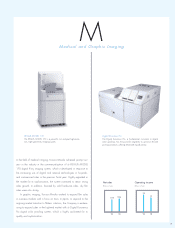
nologies; Optics; Photo Imaging; Medical and Graphic
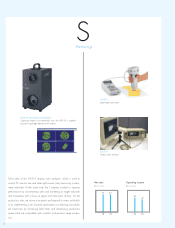
Imaging; Sensing, and Other Businesses.
Consolidated Business Results
Scope of Consolidated Business Results
On April 1, 2003, the former Konica Corporation spun off its
operating activities and shifted to a holding company structure.
Shortly thereafter, Konica Minolta Holdings, Inc. was established
on August 5, 2003, through a share exchange with Minolta
Co., Ltd. For accounting purposes, the integration with Minolta
Co., Ltd. became effective September 30, 2003. Accordingly,
the Group’s consolidated financial results for the fiscal year
ended March 31, 2004 do not include Minolta’s first-half perfor-
mance results for the fiscal year under review.
In order to provide a comparison with the previous fiscal
year’s results, however, Minolta’s first-half performance for the
fiscal year ended March 31, 2004 has been included below
and elsewhere in this report, excluding the financial statements
on pages 40 through 55. Furthermore, the consolidated finan-
cial results for the fiscal year ended March 31, 2003 include
the combined financial results of Konica Corporation and
Minolta Co., Ltd. for the year then ended.
Billions of yen
’04 ‘03 change
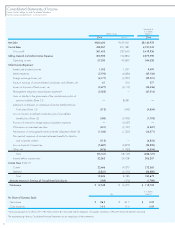
Net Sales 1,123.6 1,087.2 36.3
Operating Income 73.2 77.2 –4.0
Net Income 19.3 29.1 –9.8
In the fiscal year ended March 31, 2004, net sales totaled
¥1,123.6 billion, an increase of ¥36.3 billion, or 3.3%, com-
pared with the previous fiscal year. While the appreciation of the
yen against the U.S. dollar pushed net sales down by ¥10.6 bil-
lion, this was more than offset by an increase in net sales of
¥32.7 billion due to adjustments for overseas sales subsidiaries
whose balance dates do not coincide with the parent company.
Gross profit was ¥478.7 billion, a year-on-year increase of
¥5.9 billion, or 1.3%, which translated to a gross profit margin
of 42.6%.
Operating income amounted to ¥73.2 billion, a decrease
of ¥4.0 billion, or 5.2%, while the operating income margin
was 6.5%, down by 0.6 percentage points. Despite the positive
effects of the yen’s depreciation against the euro, which drove
operating income up by ¥8.8 billion, operating income was
negatively impacted by downward pressure on gross margins
due to increasingly intense competition, one-off integration
expenses totaling ¥8.8 billion, including cost of sales and SG&A
expenses, and an additional ¥2.4 billion in goodwill amortiza-
tion due to management integration.
Accounting for non-operating income and expenses, ordi-
nary income for the fiscal year under review totaled ¥52.5 bil-
lion, down ¥1.8 billion, or 3.3%, compared with the previous
fiscal year. Net non-operating expense improved ¥2.2 billion
and was attributed to the reduction in interest expense in connec-
tion with the repayment of a portion of interest-bearing debt and
a decline in losses relating to the disposal of inventories, notwith-
standing a rationalization expense of ¥3.1 billion in connection
to management integration.
Income before income taxes and after extraordinary items
increased ¥0.5 billion, or 1.2%, to ¥40.5 billion. Extraordinary
items improved ¥2.3 billion due to the significant drop in
expenses relating to the shift to a defined contribution pension
plan and unrealized loss in investment securities, notwithstanding
a rationalization expense of ¥5.8 billion in connection with man-
agement integration. In the fiscal year under review, net income
after taxes and minority interests totaled ¥19.3 billion, a decline
of ¥9.7 billion, or 33.5%. The major factors contributing to this
decline included an increase in income tax expense and a rever-
sal of certain deferred tax assets brought about by the non-
recognition of Group company losses for taxation purposes.
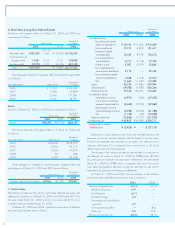
Segment Information
An overview of the Company’s performance by business segment
is provided on pages 26 through 30. The impact of movements
in foreign currency exchange rates and integration expenses on
operating income for the fiscal year ended March 31, 2004 as
compared to the previous fiscal year is summarized as follows.
Billions of yen
Operating Income
Net Sales (Loss)
’04 ‘03 ’04 ‘03
Business Technologies 618.8 594.7 62.9 52.6
Optics 85.9 54.1 15.3 12.4
Photo Imaging 278.2 280.7 (6.7) 10.4
Medical & Graphic Imaging
125.6 117.4 7.9 9.3
Sensing 9.7 9.7 1.8 2.0
Other Businesses 5.4 30.6 (7.9) (9.5)
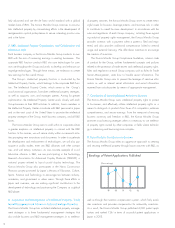
Konica Minolta Holdings, Inc. and Consolidated Subsidiaries