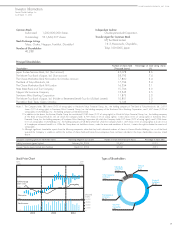
Konica Minolta 2004 Annual Report Download - page 55
Download and view the complete annual report
Please find page 55 of the 2004 Konica Minolta annual report below. You can navigate through the pages in the report by either clicking on the pages listed below, or by using the keyword search tool below to find specific information within the annual report.-
 1
1 -
2
-
3
-
4
-
5
-
6
-
7
-
8
-
9
-
10
-
11
-
12
-
13
-
14
-
15
-
16
-
17
-
18
-
19
-
20
-
21
-
22
-
23
-
24
-
25
-
26
-
27
-
28
-
29
-
30
-
31
-
32
-
33
-
34
-
35
-
36
-
37
-
38
-
39
-
40
-
41
-
42
-
43
-
44
-
 45
45 -
 46
46 -
 47
47 -
 48
48 -
 49
49 -
 50
50 -
 51
51 -
 52
52 -
 53
53 -
 54
54 -
 55
55 -
 56
56 -
 57
57 -
 58
58 -
 59
59 -
 60
60 -
 61
61 -
 62
62
 |
 |

53
KONICA MINOLTA HOLDINGS, INC. 2004
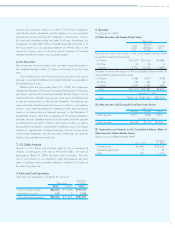
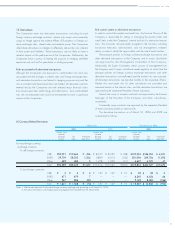
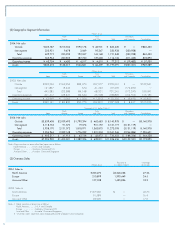
The business segment information by the former method of industry segmentation as of and for the year ended March 31, 2003 is as follows:
Millions of yen
Elimination
Business Photographic and
Machines Materials Total Corporate Consolidation
2003: Net sales
Outside ¥264,721 ¥294,319 ¥559,041 ¥ — ¥559,041
Intersegment 1,290 3,958 5,249 (5,249) —
Total 266,012 298,278 564,290 (5,249) 559,041
Operating expenses 229,513 282,412 511,925 4,260 516,185
Operating income ¥ 36,499 ¥ 15,866 ¥ 52,365 ¥ (9,510) ¥ 42,855
Assets ¥183,358 ¥271,641 ¥455,000 ¥60,956 ¥515,956
Depreciation 11,516 14,143 25,659 2,839 28,497
Capital expenditure 6,661 6,528 13,190 8,435 21,625
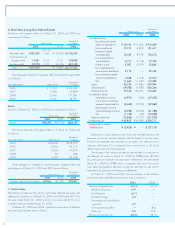
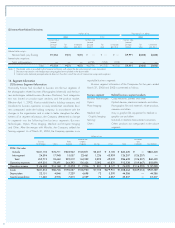
The business segment information based on the six business segments as of and for the year ended March 31, 2003 is as follows:
Millions of yen
Medical and Elimination
Business Photo Graphic and
Technologies Optics Imaging Imaging Sensing Other Total Corporate Consolidation
2003: Net sales
Outside ¥204,594 ¥44,200 ¥190,901 ¥117,420 ¥ — ¥ 1,924 ¥559,041 ¥ — ¥559,041
Intersegment 1,149 269 1,363 210 — 12,639 15,632 (15,632) —
Total 205,744 44,470 192,264 117,630 — 14,563 574,673 (15,632) 559,041
Operating expenses 183,363 31,084 185,493 108,300 — 6,866 515,018 1,077 516,185
Operating income ¥ 22,381 ¥13,385 ¥ 6,771 ¥ 9,330 ¥ — ¥ 7,696 ¥ 59,565 ¥(16,709) ¥ 42,855
Assets ¥151,278 ¥50,822 ¥140,490 ¥103,994 ¥ — ¥95,122 ¥541,708 ¥(25,752) ¥515,956
Depreciation 9,332 3,941 6,699 5,687 — 2,838 28,497 — 28,497
Capital expenditure 3,840 3,660 4,946 744 — 8,435 21,625 — 21,625
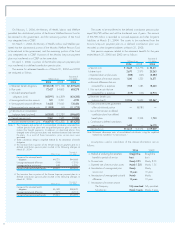
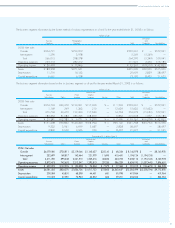
Thousands of U.S. dollars (Note 3)
Medical and Elimination
Business Photo Graphic and
Technologies Optics Imaging Imaging Sensing Other Total Corporate Consolidation
2004: Net sales
Outside
$4,079,080 $725,811 $2,119,046 $1,143,637 $25,140 $ 48,254 $ 8,140,978 $ — $8,140,978
Intersegment
232,699 169,817 142,464 221,979 11,695 415,451 1,194,124 (1,194,124) —
Total
4,311,780 895,638 2,261,510 1,365,616 36,834 463,705 9,335,112 (1,194,124) 8,140,978
Operating expenses
3,872,675 742,653 2,312,347 1,290,813 29,255 386,328 8,634,100 (1,037,440) 7,596,651
Operating income
$ 439,095 $152,976 $ (50,828) $ 74,804 $ 7,579 $ 77,368 $ 701,012 $ (156,675) $ 544,328
Assets
$4,081,503 $820,570 $1,854,736 $1,011,732 $72,883 $4,540,647 $12,382,099 $(3,208,194) $9,173,895
Depreciation
209,585 45,851 68,398 44,451 681 50,998 419,964 — 419,964
Capital expenditure
110,323 47,081 73,943 42,852 662 59,201 334,062 — 334,062