Intel 2003 Annual Report Download - page 92
Download and view the complete annual report
Please find page 92 of the 2003 Intel annual report below. You can navigate through the pages in the report by either clicking on the pages listed below, or by using the keyword search tool below to find specific information within the annual report.-
 1
1 -
2
-
3
-
4
-
5
-
6
-
7
-
8
-
9
-
10
-
11
-
12
-
13
-
14
-
15
-
16
-
17
-
18
-
19
-
20
-
21
-
22
-
23
-
24
-
25
-
26
-
27
-
28
-
29
-
30
-
31
-
32
-
33
-
34
-
35
-
36
-
37
-
38
-
39
-
40
-
41
-
42
-
43
-
44
-
45
-
46
-
47
-
48
-
49
-
50
-
51
-
52
-
53
-
54
-
55
-
56
-
57
-
58
-
59
-
60
-
61
-
62
-
63
-
64
-
65
-
66
-
67
-
68
-
69
-
70
-
71
-
72
-
73
-
74
-
75
-
76
-
77
-
78
-
79
-
80
-
81
-
 82
82 -
 83
83 -
 84
84 -
 85
85 -
 86
86 -
 87
87 -
 88
88 -
 89
89 -
 90
90 -
 91
91 -
 92
92 -
 93
93 -
 94
94 -
 95
95 -
 96
96 -
 97
97 -
 98
98 -
 99
99 -
 100
100 -
 101
101 -
 102
102 -
103
-
104
-
105
-
106
-
107
-
108
-
109
-
110
-
111
-
112
-
113
-
114
-
115
-
116
-
117
-
118
-
119
-
120
-
121
-
122
-
123
-
124
-
125
 |
 |

Table of Contents
Index to Financial Statements
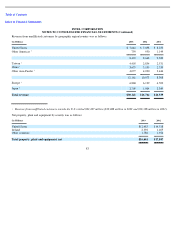
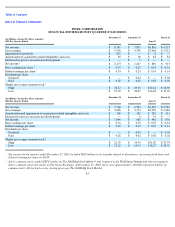
INTEL CORPORATION
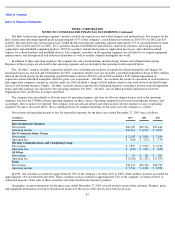
FINANCIAL INFORMATION BY QUARTER (UNAUDITED)
(In Millions—Except Per Share Amounts)
2003 For Quarter Ended
December 27
September 27
June 28
March 29
Net revenue
$
8,741
$
7,833
$
6,816
$
6,715
Gross margin
$
5,556
$
4,558
$
3,468
$
3,512
Impairment of goodwill
$
611
$
—
$
6
$
—
Amortization of acquisition
-
related intangibles and costs
$
65
$
68
$
84
$
84
Purchased in
-
process research and development
$
—
$
5
$
—
$
—
Net income
1
$
2,173
$
1,657
$
896
$
915
Basic earnings per share
1
$
0.33
$
0.25
$
0.14
$
0.14
Diluted earnings per share
1
$
0.33
$
0.25
$
0.14
$
0.14
Dividends per share
Declared
$
—
$
0.04
$
—
$
0.04
Paid
$
0.02
$
0.02
$
0.02
$
0.02
Market price range common stock
2
High
$
34.12
$
29.18
$
22.14
$
18.90
Low
$
27.52
$
20.81
$
16.28
$
15.05
(In Millions—Except Per Share Amounts)
2002 For Quarter Ended
December 28
September 28
June 29
March 30
Net revenue
$
7,160
$
6,504
$
6,319
$
6,781
Gross margin
$
3,696
$
3,173
$
2,969
$
3,480
Amortization and impairment of acquisition
-
related intangibles and costs
$
106
$
102
$
229
$
111
Purchased in
-
process research and development
$
—
$
6
$
14
$
—
Net income
$
1,049
$
686
$
446
$
936
Basic earnings per share
$
0.16
$
0.10
$
0.07
$
0.14
Diluted earnings per share
$
0.16
$
0.10
$
0.07
$
0.14
Dividends per share
Declared
$
—
$
0.04
$
—
$
0.04
Paid
$
0.02
$
0.02
$
0.02
$
0.02
Market price range common stock
2
High
$
21.05
$
19.59
$
31.20
$
35.79
Low
$
13.22
$
14.13
$
18.27
$
28.55
1
Net income for the quarter ended December 27, 2003 included $620 million in tax benefits related to divestitures, increasing both basic and
diluted earnings per share by $0.09.
85
2
Intel
’s common stock (symbol INTC) trades on The NASDAQ Stock Market* and is quoted in the Wall Street Journal and other newspapers.
Intel
’s common stock also trades on The Swiss Exchange. At December 27, 2003, there were approximately 236,000 registered holders of
common stock. All stock prices are closing prices per The NASDAQ Stock Market.