Intel 2003 Annual Report Download - page 81
Download and view the complete annual report
Please find page 81 of the 2003 Intel annual report below. You can navigate through the pages in the report by either clicking on the pages listed below, or by using the keyword search tool below to find specific information within the annual report.-
 1
1 -
2
-
3
-
4
-
5
-
6
-
7
-
8
-
9
-
10
-
11
-
12
-
13
-
14
-
15
-
16
-
17
-
18
-
19
-
20
-
21
-
22
-
23
-
24
-
25
-
26
-
27
-
28
-
29
-
30
-
31
-
32
-
33
-
34
-
35
-
36
-
37
-
38
-
39
-
40
-
41
-
42
-
43
-
44
-
45
-
46
-
47
-
48
-
49
-
50
-
51
-
52
-
53
-
54
-
55
-
56
-
57
-
58
-
59
-
60
-
61
-
62
-
63
-
64
-
65
-
66
-
67
-
68
-
69
-
70
-
 71
71 -
 72
72 -
 73
73 -
 74
74 -
 75
75 -
 76
76 -
 77
77 -
 78
78 -
 79
79 -
 80
80 -
 81
81 -
 82
82 -
 83
83 -
 84
84 -
 85
85 -
 86
86 -
 87
87 -
 88
88 -
 89
89 -
 90
90 -
 91
91 -
92
-
93
-
94
-
95
-
96
-
97
-
98
-
99
-
100
-
101
-
102
-
103
-
104
-
105
-
106
-
107
-
108
-
109
-
110
-
111
-
112
-
113
-
114
-
115
-
116
-
117
-
118
-
119
-
120
-
121
-
122
-
123
-
124
-
125
 |
 |

Table of Contents
Index to Financial Statements
INTEL CORPORATION
NOTES TO CONSOLIDATED FINANCIAL STATEMENTS (Continued)
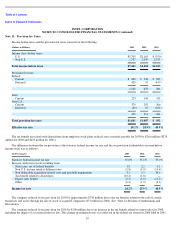
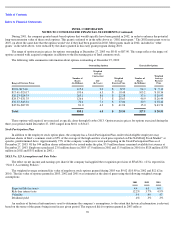
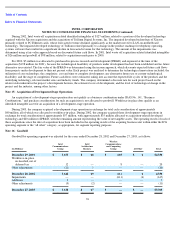
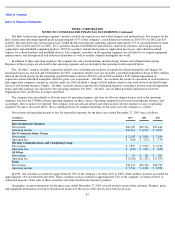
Weighted-average actuarial assumptions used to determine costs for the plans were as follows:
Asset return assumptions are derived following actuarial and statistical methodologies, from an analysis of long-term historical data
relevant to the country where each plan is in effect and the investments applicable to the plan. Plans are subject to regulation under local law,
which may directly or indirectly affect the types of investments that a plan may hold.
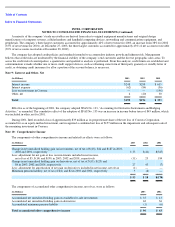
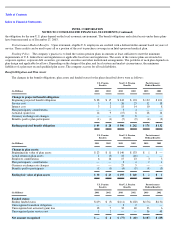
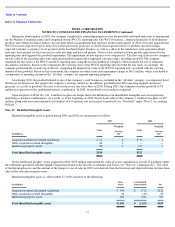
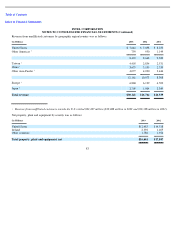
Net Periodic Benefit Cost
The net periodic benefit cost for the plans included the following components:
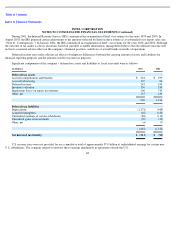
U.S. Plan Assets
The company’s U.S. Pension Plan asset allocation at the end of fiscal 2003 and 2002 was 100% allocated to equity securities. The target
allocation for 2004 is expected to remain the same. The expected long-term rate of return for these equity securities is 8%. The company’s
long-term investment goal is to provide a basic level of benefits through the U.S. Pension Plan guarantee, with an opportunity for participants
to accumulate funds in excess of amounts guaranteed by the U.S. Pension Plan through asset accumulation in the Profit Sharing Plan. The U.S.
plan assets are invested in equity securities, primarily in large, diversified domestic and multinational U.S. equities, which seek to match the
performance of the Standard and Poor’s 500 Index*. The company believes that investing in large, multinational companies achieves adequate
diversity, in that such companies represent a wide range of industries, and many of those companies derive a significant portion of their
revenue from non-U.S. sources or otherwise reflect market conditions throughout the world. When deemed appropriate, a portion of the fund
may be invested in futures contracts for the purpose of acting as a temporary substitute for investment in equity securities. The fund does not
engage in speculative futures transactions.
In order to determine the expected long-term rate of return for the U.S. plan assets, the company used actuarial and statistical methods to
estimate the likely results over a 20-year time horizon. The analysis was based on historical equity market returns during the period from 1926
to 2002. Management selected a rate of return within the likely range reflecting a conservative view of future expected returns.
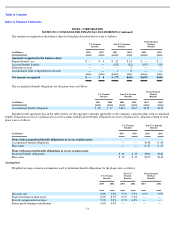
Funding Expectation for 2004
No further contributions are required during 2004 under applicable law for the U.S. Pension Plan. The company intends to make
voluntary contributions so that assets exceed the Accumulated Benefit Obligation at the end of the year. Employer contributions to the
Postretirement Medical Benefits Plan are expected to be approximately $4 million during 2004.
74
U.S. Pension
Benefits
Non-U.S.
Pension
Benefits
Postretirement
Medical
Benefits
2003
2002
2003
2002
2003
2002
Discount rate
7.0
%
7.0
%
5.5
%
7.9
%
6.0
%
7.0
%
Expected return on plan assets
8.0
%
8.5
%
6.7
%
9.2
%
—
—
Rate of compensation increase
5.0
%
5.0
%
3.5
%
6.8
%
—
—
Future profit
-
sharing contributions
6.0
%
6.0
%
—
—
—
—
U.S. Pension Benefits
Non-U.S. Pension
Benefits
Postretirement Medical
Benefits
(In Millions)
2003
2002
2001
2003
2002
2001
2003
2002
2001
Service cost
$
7
$
6
$
3
$
27
$
22
$
34
$
12
$
10
$
9
Interest cost
2
2
1
18
14
13
10
8
7
Expected return on plan assets
(2
)
(1
)
(1
)
(1
)
(12
)
(15
)
—
—
—
Amortization of prior service cost
1
—
—
—
—
1
4
4
4
Recognized net actuarial (gain) loss
1
—
—
1
—
1
—
—
—
Net periodic benefit cost
$
9
$
7
$
3
$
45
$
24
$
34
$
26
$
22
$
20