Intel 2003 Annual Report Download - page 42
Download and view the complete annual report
Please find page 42 of the 2003 Intel annual report below. You can navigate through the pages in the report by either clicking on the pages listed below, or by using the keyword search tool below to find specific information within the annual report.-
 1
1 -
2
-
3
-
4
-
5
-
6
-
7
-
8
-
9
-
10
-
11
-
12
-
13
-
14
-
15
-
16
-
17
-
18
-
19
-
20
-
21
-
22
-
23
-
24
-
25
-
26
-
27
-
28
-
29
-
30
-
31
-
 32
32 -
 33
33 -
 34
34 -
 35
35 -
 36
36 -
 37
37 -
 38
38 -
 39
39 -
 40
40 -
 41
41 -
 42
42 -
 43
43 -
 44
44 -
 45
45 -
 46
46 -
 47
47 -
 48
48 -
 49
49 -
 50
50 -
 51
51 -
 52
52 -
53
-
54
-
55
-
56
-
57
-
58
-
59
-
60
-
61
-
62
-
63
-
64
-
65
-
66
-
67
-
68
-
69
-
70
-
71
-
72
-
73
-
74
-
75
-
76
-
77
-
78
-
79
-
80
-
81
-
82
-
83
-
84
-
85
-
86
-
87
-
88
-
89
-
90
-
91
-
92
-
93
-
94
-
95
-
96
-
97
-
98
-
99
-
100
-
101
-
102
-
103
-
104
-
105
-
106
-
107
-
108
-
109
-
110
-
111
-
112
-
113
-
114
-
115
-
116
-
117
-
118
-
119
-
120
-
121
-
122
-
123
-
124
-
125
 |
 |

Table of Contents
Index to Financial Statements
MANAGEMENT’S DISCUSSION AND ANALYSIS OF FINANCIAL CONDITION AND RESULTS OF OPERATIONS
(Continued)
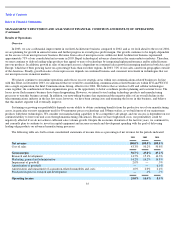
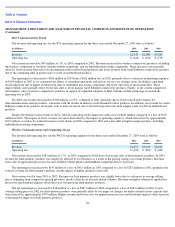
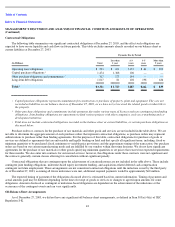
Operating Expenses
Operating expenses for the three years ended December 27, 2003 were as follows:
Research and development spending increased $326 million, or 8%, in 2003 compared to 2002, and increased $238 million, or 6%, in
2002 compared to 2001. The increase in 2003 compared to 2002 was primarily due to higher expenses for product development programs in
the Intel Architecture business and higher spending on the development of manufacturing process technologies, including the 65-nanometer
process technology, as well as higher profit-dependent compensation expenses. The increase in 2002 compared to 2001 was primarily due to
higher spending on the development of manufacturing process technologies, including the 90-nanometer process technology.
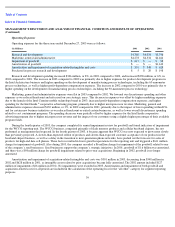
Marketing, general and administrative expenses were flat in 2003 compared to 2002. We lowered our discretionary spending and other
expenses as we reduced headcount and refocused on core strategic areas. This decrease in expenses was offset by higher marketing expenses
due to the launch of the Intel Centrino mobile technology brand in 2003; increased profit-dependent compensation expenses; and higher
spending for the Intel Inside
®
cooperative advertising program, primarily due to higher microprocessor revenue. Marketing, general and
administrative expenses decreased $130 million, or 3%, in 2002 compared to 2001, primarily due to the impact of lower spending within ICG
and for certain new business initiatives as we reduced headcount or exited certain businesses, as well as lower overall discretionary spending
related to cost containment programs. The spending decreases were partially offset by higher expenses for the Intel Inside cooperative
advertising program due to higher microprocessor revenue and the impact of our customers using a slightly higher percentage of their available
program funds.
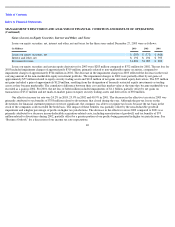
During the fourth quarter of 2003, the company completed its annual impairment review for goodwill and found indicators of impairment
for the WCCG reporting unit. The WCCG business, comprised primarily of flash memory products and cellular baseband chipsets, has not
performed as management had expected. In the fourth quarter of 2003, it became apparent that WCCG was now expected to grow more slowly
than previously projected. A slower-than-expected rollout of products and slower-than-expected customer acceptance of our products in the
baseband chipset business, as well as a delay in the transition to next-generation phone networks, have pushed out the forecasts for sales of
products for high-end data cell phones. These factors resulted in lower growth expectations for the reporting unit and triggered a $611 million
charge for impairment of goodwill. Also during 2003, the company recorded a $6 million charge for impairment of the goodwill related to one
of the company’s seed businesses. Seed businesses support the company’
s strategic initiatives. In 2001, goodwill of $1.6 billion was amortized,
and there was a $98 million charge for goodwill impairment related to prior-year acquisitions. Beginning in 2002, goodwill is no longer
amortized.
Amortization and impairment of acquisition-related intangibles and costs was $301 million in 2003, decreasing from $548 million in
2002 and $628 million in 2001, as intangible assets related to prior acquisitions became fully amortized. The 2002 amount included $127
million of impairments ($26 million in 2001). No impairments were recorded in 2003. Amortization and impairment of both goodwill and
acquisition-related costs for all periods are included in the calculation of the operating loss for the “all other” category for segment reporting
purposes.
39
(In Millions)
2003
2002
2001
Research and development
$
4,360
$
4,034
$
3,796
Marketing, general and administrative
$
4,278
$
4,334
$
4,464
Impairment of goodwill
$
617
$
—
$
98
Amortization of goodwill
$
—
$
—
$
1,612
Amortization and impairment of acquisition
-
related intangibles and costs
$
301
$
548
$
628
Purchased in
-
process research and development
$
5
$
20
$
198