Intel 2003 Annual Report Download - page 49
Download and view the complete annual report
Please find page 49 of the 2003 Intel annual report below. You can navigate through the pages in the report by either clicking on the pages listed below, or by using the keyword search tool below to find specific information within the annual report.-
 1
1 -
2
-
3
-
4
-
5
-
6
-
7
-
8
-
9
-
10
-
11
-
12
-
13
-
14
-
15
-
16
-
17
-
18
-
19
-
20
-
21
-
22
-
23
-
24
-
25
-
26
-
27
-
28
-
29
-
30
-
31
-
32
-
33
-
34
-
35
-
36
-
37
-
38
-
 39
39 -
 40
40 -
 41
41 -
 42
42 -
 43
43 -
 44
44 -
 45
45 -
 46
46 -
 47
47 -
 48
48 -
 49
49 -
 50
50 -
 51
51 -
 52
52 -
 53
53 -
 54
54 -
 55
55 -
 56
56 -
 57
57 -
 58
58 -
 59
59 -
60
-
61
-
62
-
63
-
64
-
65
-
66
-
67
-
68
-
69
-
70
-
71
-
72
-
73
-
74
-
75
-
76
-
77
-
78
-
79
-
80
-
81
-
82
-
83
-
84
-
85
-
86
-
87
-
88
-
89
-
90
-
91
-
92
-
93
-
94
-
95
-
96
-
97
-
98
-
99
-
100
-
101
-
102
-
103
-
104
-
105
-
106
-
107
-
108
-
109
-
110
-
111
-
112
-
113
-
114
-
115
-
116
-
117
-
118
-
119
-
120
-
121
-
122
-
123
-
124
-
125
 |
 |

Table of Contents
Index to Financial Statements
MANAGEMENT’S DISCUSSION AND ANALYSIS OF FINANCIAL CONDITION AND RESULTS OF OPERATIONS
(Continued)
Business Outlook
As we look ahead to the rest of 2004, we are planning for growth in annual revenue and further progress in gross profit margin. We
expect continued growth in the total number of computers using the Intel Pentium 4 processor as well as increasing acceptance of our Pentium
M processor, the processor integral to Intel Centrino mobile technology. Demand for our flash memory products is uncertain in the highly
competitive cellular handset market segment. Revenue growth for our flash memory products is largely dependent on customer demand for
higher density flash memory and continued end user adoption of new leading-edge cellular handsets. The outlook for the telecommunications
industry continues to be soft. In this environment, revenue growth for our networking and communications business is largely dependent on our
securing design wins for new products, and OEMs taking these product designs to production.
Our financial results are substantially dependent on sales of microprocessors and related components by the Intel Architecture operating
segment. Revenue is partly a function of the mix of microprocessor types and speeds sold, as well as the mix of related chipsets and
motherboards, all of which are difficult to forecast. Because of the wide price differences among performance desktop, value desktop, mobile
and server microprocessors, the mix of types of microprocessors sold affects the average price that we will realize and has a large impact on
our revenue and gross margin. Microprocessor revenue is also dependent on the availability of other parts of the system platform, including
chipsets, motherboards, operating system software and application software. Revenue is also affected by our sales of other semiconductor and
non-semiconductor products, and is subject to the impact of economic conditions in various geographic regions.
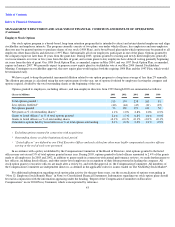
Our gross margin expectation for 2004 is 62% plus or minus a few points. The 62% midpoint is five points higher than the 2003 gross
margin of 57%. The gross margin expectation reflects the substantial year-to-year growth that we have seen in the Intel Architecture business
and the impact of spreading our fixed costs over a greater number of units. Gross margin should also benefit from the productive use of 90-
nanometer technology and 300mm wafers, as we build more of our mainstream products with these technologies. Our gross margin varies
primarily with revenue levels, which are dependent on unit volumes and prices as well as the mix of types and speeds of processors sold, and
the mix of microprocessors, related chipsets and motherboards, and other semiconductor and non-semiconductor products. Variability of other
factors will also continue to affect cost of sales and the gross margin percentage, including unit costs and yield issues associated with
production at our factories, timing and execution of the manufacturing ramp including the ramp of the 90-nanometer process technology on
300mm wafers, excess manufacturing capacity, the reusability of factory equipment, impairment of manufacturing or assembly and test assets,
excess inventory, inventory obsolescence and variations in inventory valuation.
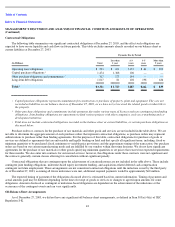
We have significantly expanded our semiconductor manufacturing and assembly and test capacity over the last few years, and we
continue to plan capacity based on the assumed continued success of our overall strategy and the acceptance of our products in specific market
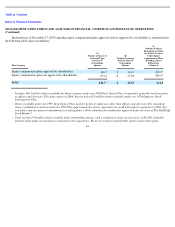
segments. We currently expect that capital spending will be between $3.6 billion and $4.0 billion in 2004, compared to $3.7 billion in 2003.
The midpoint of this range, $3.8 billion, is only slightly higher than in 2003. Most of the capital spending for 2004 will go to building or
equipping our 300mm wafer facilities. The efficiencies of 300mm wafers translate into more capacity for less invested capital. In terms of end
use, about 85% of the budget is directed to manufacturing capability, the same portion as in 2003. We expect more than half of the capital
spending to go toward fabrication (fab) manufacturing equipment, and more than a quarter to land and construction. The remaining portion is
expected to be spent on other machinery and equipment. In terms of technology, the emphasis in capital spending is shifting to smaller
geometries. Over 60% of the 2004 budget for fab manufacturing equipment is expected to be invested in manufacturing processes of 65
nanometer and smaller. This capital spending plan is dependent on expectations regarding production efficiencies and delivery times of various
machinery and equipment, and construction schedules for new facilities. If the demand for our products does not grow and continue to move
toward higher performance products in the various market segments, revenue and gross margin would be adversely affected, manufacturing
and/or assembly and test capacity would be under-utilized, and the rate of capital spending could be further reduced. We could be required to
record an impairment of our manufacturing or assembly and test equipment and/or facilities, or factory planning decisions may cause us to
record accelerated depreciation. However, in the long term, revenue and gross margin may also be adversely affected if we do not add capacity
fast enough to meet increased market demand.
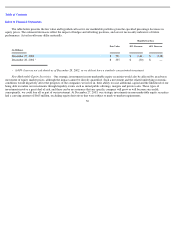
Depreciation for 2004 is expected to be approximately $4.6 billion, compared to $4.7 billion in 2003.
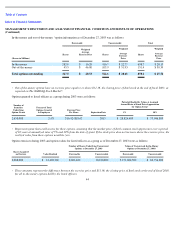
Our industry is characterized by very short product life cycles, and our continued success is dependent on technological advancement,
including developing and implementing new processes and strategic products for specific market segments. Because we consider it imperative
to maintain a strong research and development program, spending for research and development in 2004 is
46