Intel 2003 Annual Report Download - page 55
Download and view the complete annual report
Please find page 55 of the 2003 Intel annual report below. You can navigate through the pages in the report by either clicking on the pages listed below, or by using the keyword search tool below to find specific information within the annual report.-
 1
1 -
2
-
3
-
4
-
5
-
6
-
7
-
8
-
9
-
10
-
11
-
12
-
13
-
14
-
15
-
16
-
17
-
18
-
19
-
20
-
21
-
22
-
23
-
24
-
25
-
26
-
27
-
28
-
29
-
30
-
31
-
32
-
33
-
34
-
35
-
36
-
37
-
38
-
39
-
40
-
41
-
42
-
43
-
44
-
 45
45 -
 46
46 -
 47
47 -
 48
48 -
 49
49 -
 50
50 -
 51
51 -
 52
52 -
 53
53 -
 54
54 -
 55
55 -
 56
56 -
 57
57 -
 58
58 -
 59
59 -
 60
60 -
 61
61 -
 62
62 -
 63
63 -
 64
64 -
 65
65 -
66
-
67
-
68
-
69
-
70
-
71
-
72
-
73
-
74
-
75
-
76
-
77
-
78
-
79
-
80
-
81
-
82
-
83
-
84
-
85
-
86
-
87
-
88
-
89
-
90
-
91
-
92
-
93
-
94
-
95
-
96
-
97
-
98
-
99
-
100
-
101
-
102
-
103
-
104
-
105
-
106
-
107
-
108
-
109
-
110
-
111
-
112
-
113
-
114
-
115
-
116
-
117
-
118
-
119
-
120
-
121
-
122
-
123
-
124
-
125
 |
 |

Table of Contents
Index to Financial Statements
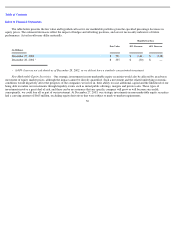
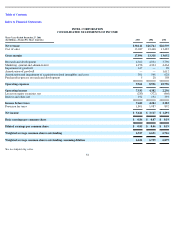
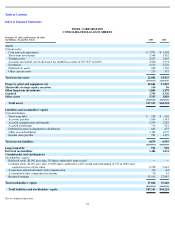
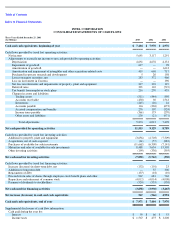
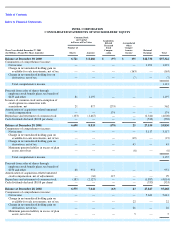
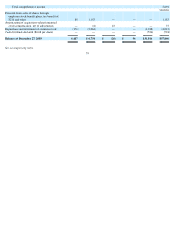
INTEL CORPORATION
CONSOLIDATED STATEMENTS OF INCOME
See accompanying notes.
52
Three Years Ended December 27, 2003
(In Millions—Except Per Share Amounts)
2003
2002
2001
Net revenue
$
30,141
$
26,764
$
26,539
Cost of sales
13,047
13,446
13,487
Gross margin
17,094
13,318
13,052
Research and development
4,360
4,034
3,796
Marketing, general and administrative
4,278
4,334
4,464
Impairment of goodwill
617
—
98
Amortization of goodwill
—
—
1,612
Amortization and impairment of acquisition
-
related intangibles and costs
301
548
628
Purchased in
-
process research and development
5
20
198
Operating expenses
9,561
8,936
10,796
Operating income
7,533
4,382
2,256
Losses on equity securities, net
(283
)
(372
)
(466
)
Interest and other, net
192
194
393
Income before taxes
7,442
4,204
2,183
Provision for taxes
1,801
1,087
892
Net income
$
5,641
$
3,117
$
1,291
Basic earnings per common share
$
0.86
$
0.47
$
0.19
Diluted earnings per common share
$
0.85
$
0.46
$
0.19
Weighted average common shares outstanding
6,527
6,651
6,716
Weighted average common shares outstanding, assuming dilution
6,621
6,759
6,879