Intel 2003 Annual Report Download - page 70
Download and view the complete annual report
Please find page 70 of the 2003 Intel annual report below. You can navigate through the pages in the report by either clicking on the pages listed below, or by using the keyword search tool below to find specific information within the annual report.-
 1
1 -
2
-
3
-
4
-
5
-
6
-
7
-
8
-
9
-
10
-
11
-
12
-
13
-
14
-
15
-
16
-
17
-
18
-
19
-
20
-
21
-
22
-
23
-
24
-
25
-
26
-
27
-
28
-
29
-
30
-
31
-
32
-
33
-
34
-
35
-
36
-
37
-
38
-
39
-
40
-
41
-
42
-
43
-
44
-
45
-
46
-
47
-
48
-
49
-
50
-
51
-
52
-
53
-
54
-
55
-
56
-
57
-
58
-
59
-
 60
60 -
 61
61 -
 62
62 -
 63
63 -
 64
64 -
 65
65 -
 66
66 -
 67
67 -
 68
68 -
 69
69 -
 70
70 -
 71
71 -
 72
72 -
 73
73 -
 74
74 -
 75
75 -
 76
76 -
 77
77 -
 78
78 -
 79
79 -
 80
80 -
81
-
82
-
83
-
84
-
85
-
86
-
87
-
88
-
89
-
90
-
91
-
92
-
93
-
94
-
95
-
96
-
97
-
98
-
99
-
100
-
101
-
102
-
103
-
104
-
105
-
106
-
107
-
108
-
109
-
110
-
111
-
112
-
113
-
114
-
115
-
116
-
117
-
118
-
119
-
120
-
121
-
122
-
123
-
124
-
125
 |
 |

Table of Contents
Index to Financial Statements
INTEL CORPORATION
NOTES TO CONSOLIDATED FINANCIAL STATEMENTS (Continued)
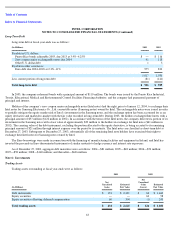
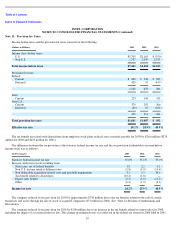
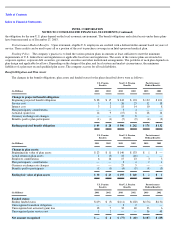
The company sold available-for-sale securities with a fair value at the date of sale of $39 million in 2003, $114 million in 2002 and $1.3
billion in 2001. The gross realized gains on these sales totaled $16 million in 2003, $15 million in 2002 and $548 million in 2001. The
company realized gross losses on sales of less than $1 million in 2003, $39 million in 2002 and $187 million in 2001. The company recognized
gains on shares exchanged in third-party merger transactions of $7 million in 2003, $1 million in 2002 and $156 million in 2001. The company
recognized impairment losses on available-for-sale and non-marketable investments of $319 million in 2003, $524 million in 2002 and $1.1
billion in 2001.
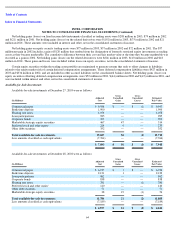
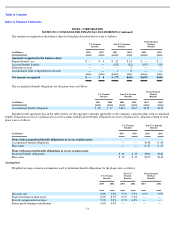
The amortized cost and estimated fair value of available-for-sale investments in debt securities at December 27, 2003, by contractual
maturity, were as follows:
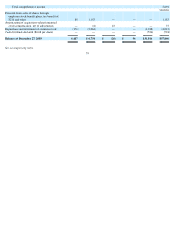
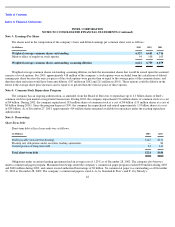
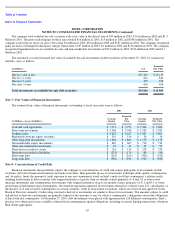
Note 7: Fair Values of Financial Instruments
The estimated fair values of financial instruments outstanding at fiscal year-ends were as follows:
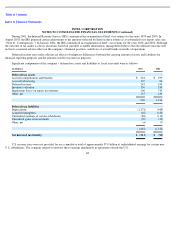
Note 8: Concentrations of Credit Risk
Financial instruments that potentially subject the company to concentrations of credit risk consist principally of investments in debt
securities, derivative financial instruments and trade receivables. Intel generally places its investments with high-credit-quality counterparties
and, by policy, limits the amount of credit exposure to any one counterparty based on Intel’s analysis of that counterparty’s relative credit
standing. Investments in debt securities with original maturities of greater than six months consist primarily of A and A2 or better rated
financial instruments and counterparties. Investments with original maturities of up to six months consist primarily of A-1 and P-1 or better
rated financial instruments and counterparties. Government regulations imposed on investment alternatives of Intel’s non-U.S. subsidiaries, or
the absence of A and A2 rated counterparties in certain countries, result in some minor exceptions, which are reviewed and approved by the
Board of Directors annually. Credit rating criteria for derivative instruments are similar to those for investments. The amounts subject to credit
risk related to derivative instruments are generally limited to the amounts, if any, by which a counterparty’s obligations exceed the obligations
of Intel with that counterparty. At December 27, 2003, debt investments were placed with approximately 220 different counterparties. Intel’s
practice is to obtain and secure available collateral from counterparties against obligations, including securities lending transactions, whenever
Intel deems appropriate.
65
(In Millions)
Cost
Estimated
Fair Value
Due in 1 year or less
$
13,120
$
13,119
Due in 1
–
2 years
842
842
Due in 2
–
5 years
378
378
Due after 5 years
626
626
Total investments in available
-
for
-
sale debt securities
$
14,966
$
14,965
2003
2002
(In Millions—Assets (Liabilities))
Carrying
Amount
Estimated
Fair
Value
Carrying
Amount
Estimated
Fair Value
Cash and cash equivalents
$
7,971
$
7,971
$
7,404
$
7,404
Short
-
term investments
$
5,568
$
5,568
$
3,382
$
3,382
Trading assets
$
2,625
$
2,625
$
1,801
$
1,801
Marketable strategic equity securities
$
514
$
514
$
56
$
56
Other long
-
term investments
$
1,866
$
1,866
$
1,178
$
1,178
Non
-
marketable equity investments
$
665
$
665
$
730
$
730
Other non
-
marketable investments
$
32
$
32
$
92
$
92
Derivatives recorded as assets
$
134
$
134
$
278
$
278
Derivatives recorded as liabilities
$
(178
)
$
(178
)
$
(89
)
$
(89
)
Short
-
term debt
$
(224
)
$
(224
)
$
(436
)
$
(432
)
Long
-
term debt
$
(936
)
$
(936
)
$
(929
)
$
(929
)