Intel 2003 Annual Report Download - page 69
Download and view the complete annual report
Please find page 69 of the 2003 Intel annual report below. You can navigate through the pages in the report by either clicking on the pages listed below, or by using the keyword search tool below to find specific information within the annual report.-
 1
1 -
2
-
3
-
4
-
5
-
6
-
7
-
8
-
9
-
10
-
11
-
12
-
13
-
14
-
15
-
16
-
17
-
18
-
19
-
20
-
21
-
22
-
23
-
24
-
25
-
26
-
27
-
28
-
29
-
30
-
31
-
32
-
33
-
34
-
35
-
36
-
37
-
38
-
39
-
40
-
41
-
42
-
43
-
44
-
45
-
46
-
47
-
48
-
49
-
50
-
51
-
52
-
53
-
54
-
55
-
56
-
57
-
58
-
 59
59 -
 60
60 -
 61
61 -
 62
62 -
 63
63 -
 64
64 -
 65
65 -
 66
66 -
 67
67 -
 68
68 -
 69
69 -
 70
70 -
 71
71 -
 72
72 -
 73
73 -
 74
74 -
 75
75 -
 76
76 -
 77
77 -
 78
78 -
 79
79 -
80
-
81
-
82
-
83
-
84
-
85
-
86
-
87
-
88
-
89
-
90
-
91
-
92
-
93
-
94
-
95
-
96
-
97
-
98
-
99
-
100
-
101
-
102
-
103
-
104
-
105
-
106
-
107
-
108
-
109
-
110
-
111
-
112
-
113
-
114
-
115
-
116
-
117
-
118
-
119
-
120
-
121
-
122
-
123
-
124
-
125
 |
 |

Table of Contents
Index to Financial Statements
INTEL CORPORATION
NOTES TO CONSOLIDATED FINANCIAL STATEMENTS (Continued)
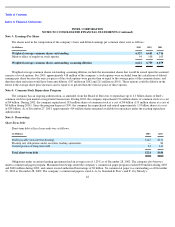
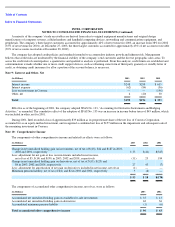
Net holding gains (losses) on fixed income debt instruments classified as trading assets were $208 million in 2003, $79 million in 2002
and $(21) million in 2001. Net holding gains (losses) on the related derivatives were $(192) million in 2003, $(75) million in 2002 and $21
million in 2001. These amounts were included in interest and other, net in the consolidated statements of income.
Net holding gains on equity security trading assets were $77 million in 2003, $57 million in 2002 and $72 million in 2001. The $57
million net gain in 2002 includes a gain of $120 million that resulted from the designation of formerly restricted equity investments as trading
assets as they became marketable. The cumulative difference between their cost and fair market value at the time they became marketable was
recorded as a gain in 2002. Net holding gains (losses) on the related derivatives were $(84) million in 2003, $110 million in 2002 and $18
million in 2001. These gains and losses were included within losses on equity securities, net in the consolidated statements of income.
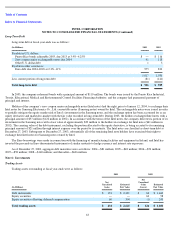
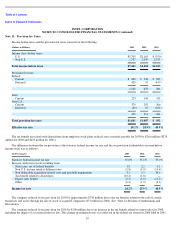
Certain equity securities within the trading asset portfolio are maintained to generate returns that seek to offset changes in liabilities
related to the equity market risk of certain deferred compensation arrangements. These deferred compensation liabilities were $427 million in
2003 and $336 million in 2002, and are included in other accrued liabilities on the consolidated balance sheets. Net holding gains (losses) on
equity securities offsetting deferred compensation arrangements were $52 million in 2003, $(64) million in 2002 and $(45) million in 2001, and
were included within interest and other, net in the consolidated statements of income.
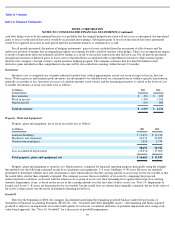
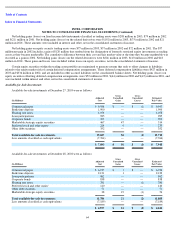
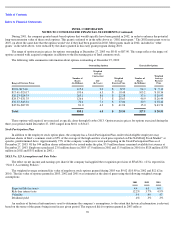
Available
-for-Sale Investments
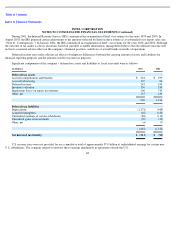
Available-for-sale investments at December 27, 2003 were as follows:
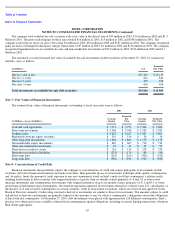
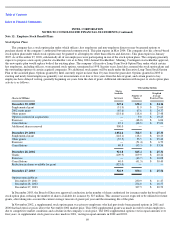
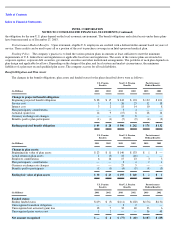
Available-for-sale investments at December 28, 2002 were as follows:
64
(In Millions)
Adjusted
Cost
Gross
Unrealized
Gains
Gross
Unrealized
Losses
Estimated
Fair Value
Commercial paper
$
9,948
$
—
$
(
1
)
$
9,947
Bank time deposits
1,900
—
—
1,900
Floating rate notes
1,078
—
—
1,078
Loan participations
985
—
—
985
Corporate bonds
703
—
—
703
Marketable strategic equity securities
467
47
—
514
Preferred stock and other equity
224
9
—
233
Other debt securities
352
—
—
352
Total available
-
for
-
sale investments
15,657
56
(1
)
15,712
Less amounts classified as cash equivalents
(7,764
)
—
—
(
7,764
)
$
7,893
$
56
$
(1
)
$
7,948
(In Millions)
Adjusted
Cost
Gross
Unrealized
Gains
Gross
Unrealized
Losses
Estimated
Fair Value
Commercial paper
$
6,935
$
1
$
—
$
6,936
Bank time deposits
2,121
1
—
2,122
Loan participations
862
—
—
862
Corporate bonds
838
—
—
838
Floating rate notes
781
—
(
1
)
780
Preferred stock and other equity
140
—
—
140
Other debt securities
71
—
—
71
Marketable strategic equity securities
38
19
(1
)
56
Total available
-
for
-
sale investments
11,786
21
(2
)
11,805
Less amounts classified as cash equivalents
(7,189
)
—
—
(
7,189
)
$
4,597
$
21
$
(2
)
$
4,616