Intel 2003 Annual Report Download - page 52
Download and view the complete annual report
Please find page 52 of the 2003 Intel annual report below. You can navigate through the pages in the report by either clicking on the pages listed below, or by using the keyword search tool below to find specific information within the annual report.-
 1
1 -
2
-
3
-
4
-
5
-
6
-
7
-
8
-
9
-
10
-
11
-
12
-
13
-
14
-
15
-
16
-
17
-
18
-
19
-
20
-
21
-
22
-
23
-
24
-
25
-
26
-
27
-
28
-
29
-
30
-
31
-
32
-
33
-
34
-
35
-
36
-
37
-
38
-
39
-
40
-
41
-
 42
42 -
 43
43 -
 44
44 -
 45
45 -
 46
46 -
 47
47 -
 48
48 -
 49
49 -
 50
50 -
 51
51 -
 52
52 -
 53
53 -
 54
54 -
 55
55 -
 56
56 -
 57
57 -
 58
58 -
 59
59 -
 60
60 -
 61
61 -
 62
62 -
63
-
64
-
65
-
66
-
67
-
68
-
69
-
70
-
71
-
72
-
73
-
74
-
75
-
76
-
77
-
78
-
79
-
80
-
81
-
82
-
83
-
84
-
85
-
86
-
87
-
88
-
89
-
90
-
91
-
92
-
93
-
94
-
95
-
96
-
97
-
98
-
99
-
100
-
101
-
102
-
103
-
104
-
105
-
106
-
107
-
108
-
109
-
110
-
111
-
112
-
113
-
114
-
115
-
116
-
117
-
118
-
119
-
120
-
121
-
122
-
123
-
124
-
125
 |
 |

Table of Contents
Index to Financial Statements
We are exposed to financial market risks, including changes in currency exchange rates, interest rates and marketable equity security
prices. To mitigate these risks, we may utilize derivative financial instruments, among other strategies. We do not use derivative financial
instruments for speculative purposes. All of the potential changes noted below are based on sensitivity analyses performed on our financial
positions at December 27, 2003. Actual results may differ materially.
Currency Exchange Rates. We generally hedge currency risks of non-U.S. dollar-denominated investments in debt securities with
offsetting currency borrowings, currency forward contracts or currency interest rate swaps. Gains and losses on these non-U.S.-currency
investments would generally be offset by corresponding losses and gains on the related hedging instruments, resulting in negligible net
exposure.
A substantial majority of our revenue, expense and capital purchasing activities are transacted in U.S. dollars. However, we do enter into
transactions in other currencies, primarily the Euro and certain other European and Asian currencies. To protect against reductions in value and
the volatility of future cash flows caused by changes in currency exchange rates, we have established balance sheet and forecasted transaction
hedging programs. Currency forward contracts are utilized in these hedging programs. Our hedging programs reduce, but do not always
entirely eliminate, the impact of currency exchange rate movements. We considered the historical trends in currency exchange rates and
determined that it was reasonably possible that adverse changes in exchange rates of 20% for all currencies could be experienced in the near
term. Such adverse changes, after taking into account hedges and offsetting positions, would have resulted in an adverse impact on income
before taxes of less than $10 million as of the end of each of 2003 and 2002.
Interest Rates. The primary objective of our investments in debt securities is to preserve principal while maximizing yields, without
significantly increasing risk. To achieve this objective, the returns on a substantial majority of our marketable investments in long-term fixed
rate debt securities are swapped to U.S. dollar LIBOR-based returns. We considered the historical volatility of the three-month LIBOR rate
experienced in prior years and determined that it was reasonably possible that an adverse change of 80 basis points, approximately 68% of the
rate at the end of 2003, could be experienced in the near term. A hypothetical 0.80% (80-basis-point) increase in interest rates, after taking into
account hedges and offsetting positions, would have resulted in a decrease in the fair value of our investment securities of approximately $10
million or less as of the end of each of 2003 and 2002.
Marketable Equity Security Prices. We have a portfolio of equity investments that includes marketable strategic equity securities,
trading assets and derivative equity instruments such as warrants and options, as well as non-marketable equity investments. We invest in
companies that develop software, hardware and other technologies or provide services supporting technologies. This strategic investment
program helps advance our overall mission to be the preeminent supplier of building blocks to the worldwide Internet economy. Our current
investment focus areas include: enabling mobile and Internet client devices, helping to create the digital home, advancing high-performance
communications infrastructure and developing the next generation of silicon production technologies. Our focus areas tend to develop and
change over time due to rapid advancements in the technology field.
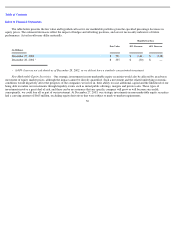
To the extent that our marketable portfolio of investments continues to have strategic value, we typically do not attempt to reduce or
eliminate our market exposure. For those securities that we no longer consider strategic, we evaluate market and economic factors in our
decision on the timing of disposal and whether it is possible and appropriate to hedge the equity market risk. As of December 27, 2003, the fair
value of our portfolio of marketable equity investments and equity derivative instruments, including hedging positions, was $591 million.
To assess the market price sensitivity of our marketable portfolio, we analyzed the historical movements over the past several years of
high-technology stock indices that we considered appropriate. Based on the analysis of these indices, we estimated that it was reasonably
possible that the prices of the stocks in our portfolio could experience a 30% adverse change in the near term. However, our marketable
portfolio is substantially concentrated in one company, which will affect the marketable portfolio’s price volatility. We currently have an
investment in Micron Technology, Inc. of approximately $458 million, or 77% of the total marketable value including equity derivative
instruments. The investment in Micron is part of our strategy to support the development and supply of Dynamic Random Access Memory
(DRAM) products. We analyzed the historical volatility of Micron’s stock, and if the stock behaves with the same price volatility that it has in
the past, we could experience a 60% loss. If we apply a 60% hypothetical change to the entire portfolio, the hypothetical loss would be
significantly larger than the loss assuming a 30% decline.
49
ITEM 7A.
QUANTITATIVE AND QUALITATIVE DISCLOSURES ABOUT MARKET RISK