Hyundai 2001 Annual Report Download - page 64
Download and view the complete annual report
Please find page 64 of the 2001 Hyundai annual report below. You can navigate through the pages in the report by either clicking on the pages listed below, or by using the keyword search tool below to find specific information within the annual report.-
 1
1 -
2
-
3
-
4
-
5
-
6
-
7
-
8
-
9
-
10
-
11
-
12
-
13
-
14
-
15
-
16
-
17
-
18
-
19
-
20
-
21
-
22
-
23
-
24
-
25
-
26
-
27
-
28
-
29
-
30
-
31
-
32
-
33
-
34
-
35
-
36
-
37
-
38
-
39
-
40
-
41
-
42
-
43
-
44
-
45
-
46
-
47
-
48
-
49
-
50
-
51
-
52
-
53
-
 54
54 -
 55
55 -
 56
56 -
 57
57 -
 58
58 -
 59
59 -
 60
60 -
 61
61 -
 62
62 -
 63
63 -
 64
64 -
 65
65 -
 66
66 -
 67
67 -
 68
68 -
 69
69
 |
 |
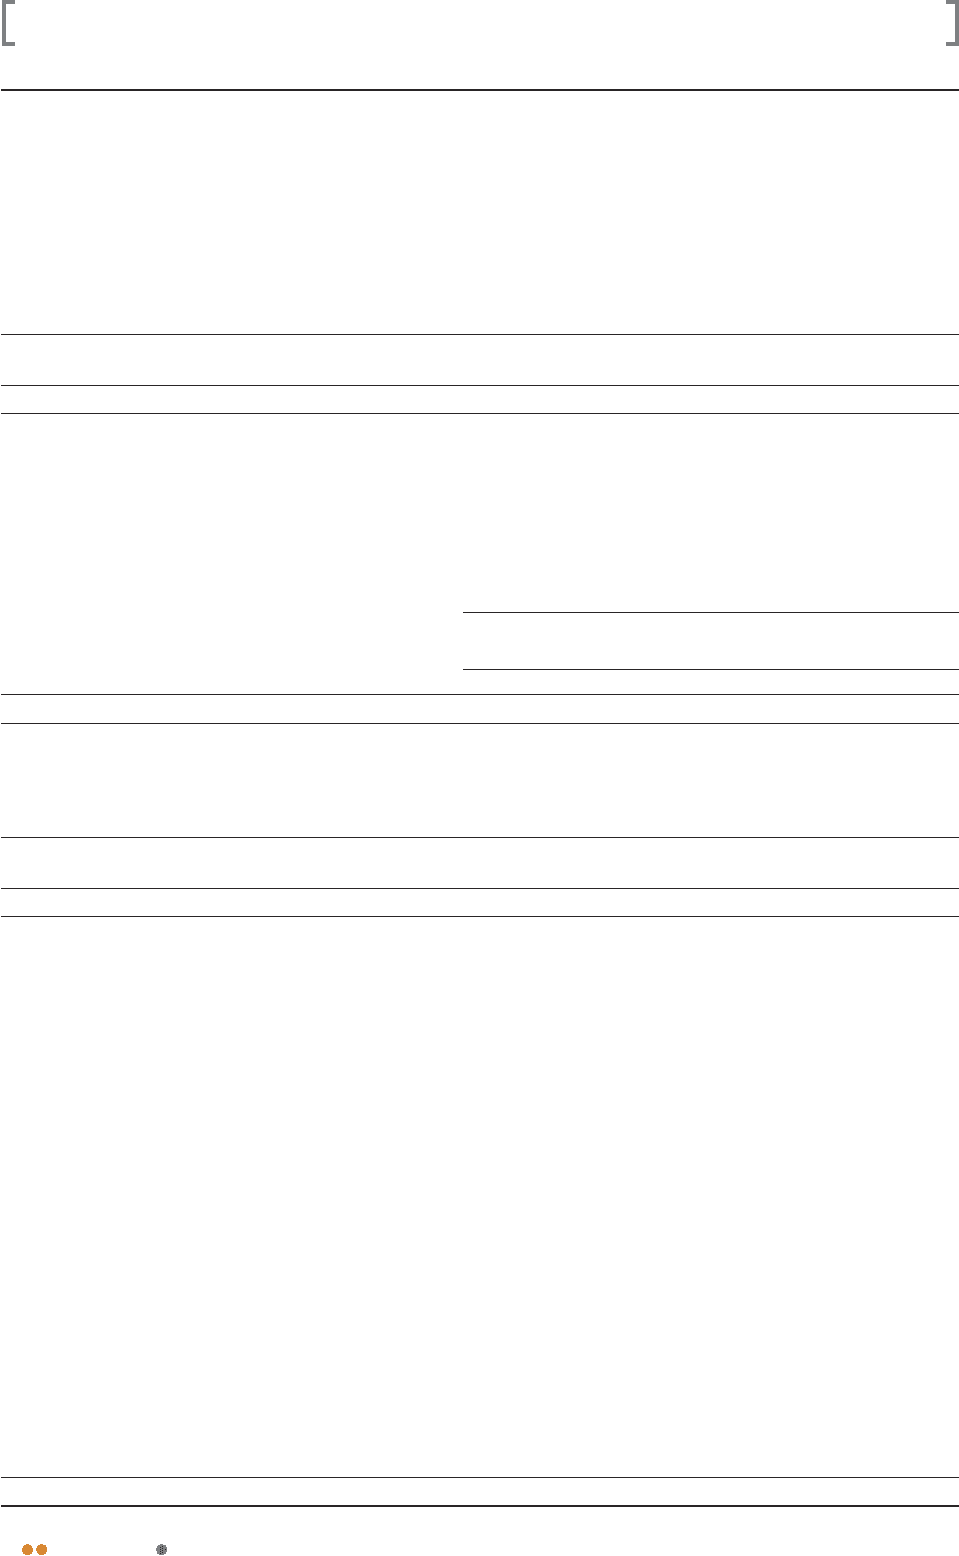
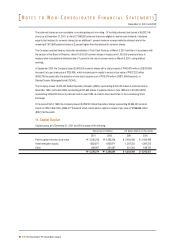
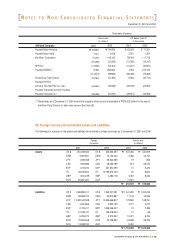
December 31, 2001 and 2000
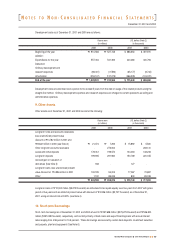
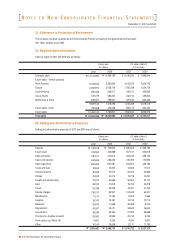
21. Adherence to Protection of Environment
The Company has been qualified as an Environmentally Friendly Company by the government and has been
ISO 14001 certified since 1995.
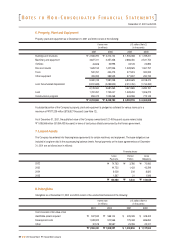
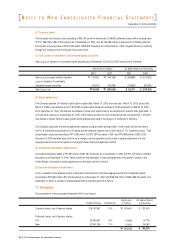
22. Regional Sales Information
Sales by region in 2001 and 2000 are as follows:
Domestic sales
Export sales - Vehicle products
North America
Europe
South America
Asia & Pacific
Middle Asia & Africa
Export sales - Other
Export sales
Total sales
2001
$9,128,243
4,105,975
1,780,339
446,471
432,154
481,530
7,246,469
596,175
7,842,644
$ 16,970,887
2000
$7,893,944
2,526,705
1,534,739
405,865
449,640
602,464
5,519,413
334,460
5,853,873
$ 13,747,817
2000
"10,468,159
3,350,664
2,035,218
538,217
596,267
798,927
7,319,293
443,528
7,762,821
"
"18,230,980
2001
"12,104,963
5,444,934
2,360,907
592,065
573,079
638,557
9,609,542
790,588
10,400,130
"
"22,505,093
U.S. dollars (Note 2)
(in thousands)
Korean won
(in millions)
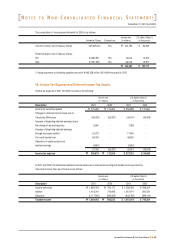
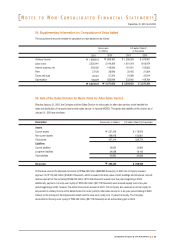
Salaries
Export costs
Sales promotion
Sales commissions
Sales warranties
Taxes and dues
Communications
Utilities
Freight and warehousing
Rent
Travel
Service charges
Maintenance
Supplies
Research
Depreciation
Amortization
Provision for doubtful accounts
Stock option cost (Note 16)
Other
2001
$ 565,506
357,101
324,335
184,493
644,507
14,806
20,005
15,718
52,967
19,742
43,057
102,632
8,502
14,132
25,369
33,630
27,362
40,413
4,284
12,171
$ 2,510,732
2000
$ 548,180
303,815
238,153
170,594
446,186
11,513
20,866
15,091
45,747
20,978
41,723
64,347
7,665
13,710
8,744
16,644
26,668
9,790
4,921
11,792
$ 2,027,127
2000
"726,942
402,889
315,814
226,224
591,687
15,267
27,670
20,012
60,665
27,819
55,329
85,331
10,165
18,181
11,596
22,071
35,364
12,983
6,526
15,638
"
"2,688,173
2001
"749,918
473,552
430,101
244,656
854,680
19,634
26,529
20,843
70,240
26,180
57,098
136,100
11,274
18,740
33,642
44,597
36,285
53,592
5,681
16,140
"
"3,329,482
U.S. dollars (Note 2)
(in thousands)
Korean won
(in millions)
N
OTES TO
N
ON
-C
ONSOLIDATED
F
INANCIAL
S
TATEMENTS
23. Selling and Administrative Expenses
Selling and administrative expenses in 2001 and 2000 are as follows:
66
2001 Annual Report Hyundai Motor Company