Hyundai 2001 Annual Report Download - page 62
Download and view the complete annual report
Please find page 62 of the 2001 Hyundai annual report below. You can navigate through the pages in the report by either clicking on the pages listed below, or by using the keyword search tool below to find specific information within the annual report.-
 1
1 -
2
-
3
-
4
-
5
-
6
-
7
-
8
-
9
-
10
-
11
-
12
-
13
-
14
-
15
-
16
-
17
-
18
-
19
-
20
-
21
-
22
-
23
-
24
-
25
-
26
-
27
-
28
-
29
-
30
-
31
-
32
-
33
-
34
-
35
-
36
-
37
-
38
-
39
-
40
-
41
-
42
-
43
-
44
-
45
-
46
-
47
-
48
-
49
-
50
-
51
-
 52
52 -
 53
53 -
 54
54 -
 55
55 -
 56
56 -
 57
57 -
 58
58 -
 59
59 -
 60
60 -
 61
61 -
 62
62 -
 63
63 -
 64
64 -
 65
65 -
 66
66 -
 67
67 -
 68
68 -
 69
69
 |
 |

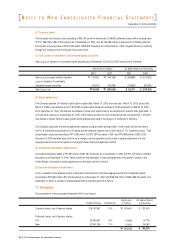
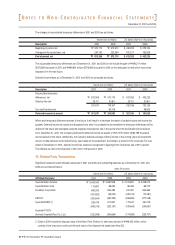
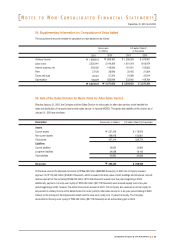
December 31, 2001 and 2000
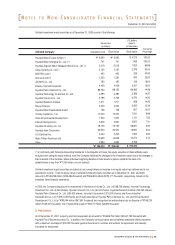
When each temporary difference reverses in the future, it will result in a decrease (increase) of taxable income and income tax
payable. Deferred income tax assets are recognized only when it is probable the tax benefits from temporary differences will be
realized in the future and calculated using the expected corporate tax rate in the period when the tax benefits will be realized.
As of December 31, 2001, the Company believes the deferred income tax assets of "241,570 million ($182,165 thousand)
can be realized in the future. Additionally, the Company believes average ordinary income in the coming years will exceed the
amount of deferred taxes to be realized every year based on its assessment. According to a revision in the Corporate Tax Law
dated on December 31, 2001, deferred income tax assets are recognized in applying to the revised tax rate of 29.7 percent.
The effective tax rate is 30.04 percent in 2001 and 14.39 percent in 2000.
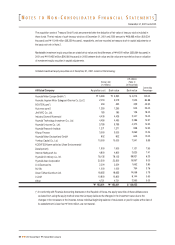
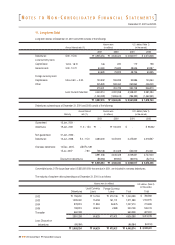
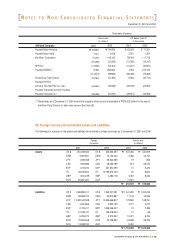
19. Related Party Transactions
Significant transactions with affiliated companies in 2001 and 2000 and outstanding balances as of December 31, 2001 and
2000 are summarized below:
(*) Sales in 2000 include the disposal value of the Motor Parts Division for after-sales service of "446,422 million, which
consists of the lump-sum royalty and the book value of the disposed net assets (see Note 25).
Description
Accumulated temporary
differences, net
Statutory tax rate
Tax credit carried over
Deferred income tax assets
2001
$613,352
29.7%
182,165
-
$182,165
2000
$432,225
30.8%
133,125
48,500
$181,625
2000
"573,174
30.8%
176,357
64,316
"
"240,853
2001
"813,366
29.7%
241,570
-
"
"241,570
U.S. dollars (Note 2) (in thousands)Korean won (in millions)
Affiliated Company
Hyundai Motor America
Hyundai Motor India
Kia Motor Corporation
KEFICO
Hyundai MOBIS (*)
Hyundai HYSCO
(formerly Hyundai Pipe Co., Ltd.)
2001
$ 4,104,851
86,484
610,281
(345,313)
(226,864)
173,047
(479,840)
(174,993)
2000
$ 2,238,073
65,072
603,562
(70,281)
(277,048)
461,275
(243,697)
(229,737)
2000
"2,967,908
86,292
800,383
(93,200)
(367,393)
611,697
(323,167)
(304,654)
2001
"5,443,443
114,687
809,293
(457,920)
(300,844)
229,478
(636,316)
(232,058)
U.S. dollars (Note 2) (in thousands)
Sales (Purchases)
Korean won (in millions)
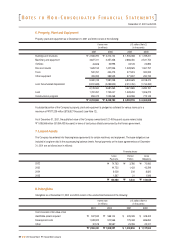
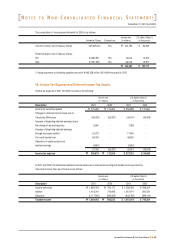
The changes in accumulated temporary differences in 2001 and 2000 are as follows:
The accumulated temporary differences as of December 31, 2001 and 2000 do not include the gain of "498,211 million
($375,696 thousand) in 2001 and "499,891 million ($376,963 thousand) in 2000 on the revaluation of land which may not be
disposed of in the near future.
Deferred income taxes as of December 31, 2001 and 2000 are computed as follows:
Description
Beginning of period, net
Changes in the current year, net
End of period, net
2001
$ 432,225
181,127
$ 613,352
2000
$ 279,700
152,525
$ 432,225
2000
"370,910
202,264
"
"573,174
2001
"573,174
240,192
"
"813,366
U.S. dollars (Note 2) (in thousands)Korean won (in millions)
N
OTES TO
N
ON
-C
ONSOLIDATED
F
INANCIAL
S
TATEMENTS
64
2001 Annual Report Hyundai Motor Company