Hyundai 2001 Annual Report Download - page 48
Download and view the complete annual report
Please find page 48 of the 2001 Hyundai annual report below. You can navigate through the pages in the report by either clicking on the pages listed below, or by using the keyword search tool below to find specific information within the annual report.-
 1
1 -
2
-
3
-
4
-
5
-
6
-
7
-
8
-
9
-
10
-
11
-
12
-
13
-
14
-
15
-
16
-
17
-
18
-
19
-
20
-
21
-
22
-
23
-
24
-
25
-
26
-
27
-
28
-
29
-
30
-
31
-
32
-
33
-
34
-
35
-
36
-
37
-
 38
38 -
 39
39 -
 40
40 -
 41
41 -
 42
42 -
 43
43 -
 44
44 -
 45
45 -
 46
46 -
 47
47 -
 48
48 -
 49
49 -
 50
50 -
 51
51 -
 52
52 -
 53
53 -
 54
54 -
 55
55 -
 56
56 -
 57
57 -
 58
58 -
59
-
60
-
61
-
62
-
63
-
64
-
65
-
66
-
67
-
68
-
69
 |
 |
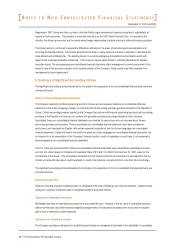
December 31, 2001 and 2000
Income Tax Expense
The Company recognizes deferred income taxes. Accordingly, income tax expense is determined by adding or deducting the
total income tax and surtaxes to be paid for the current period and the changes in deferred income tax debits (credits).
Earnings Per Share
Primary earnings per common share is computed by dividing net income, after deduction for expected dividends on preferred
stock, by the weighted average number of common shares outstanding during the year. The number of shares used in
computing earnings per common share is 215,692,671 in 2001 and 199,249,370 in 2000. Earnings per diluted share is
computed by dividing net income, after deduction for expected dividends on preferred stock and addition for the effect of
expenses related to diluted securities on net income, by the weighted average number of common shares plus the dilutive
potential common shares. The number of shares used in computing earnings per diluted share is 216,110,199 and
202,736,308, in 2001 and 2000, respectively. In 2001, the effect of dilution due to the dilutive potential common shares did not occur.
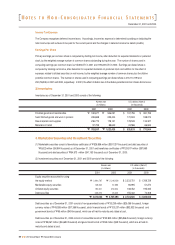
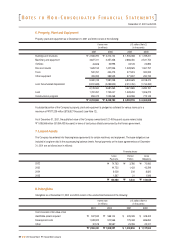
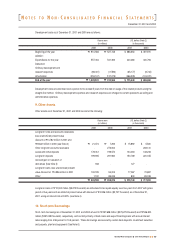
3.Inventories
Inventories as of December 31, 2001 and 2000 consist of the following:
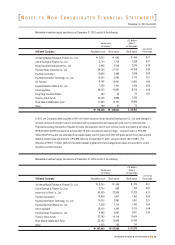
4. Marketable Securities and Investment Securities
(1) Marketable securities consist of beneficiary certificates of "526,856 million ($397,297 thousand) and debt securities of
"6,622 million ($4,994 thousand) as of December 31, 2001 and beneficiary certificates of "129,917 million ($97,969
thousand) and debt securities of "54,573 million ($41,153 thousand) as of December 31, 2000.
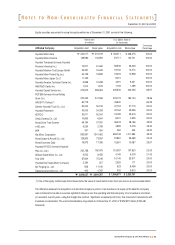
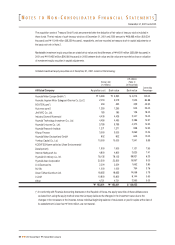
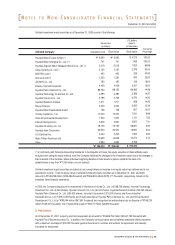
(2) Investment securities as of December 31, 2001 and 2000 consist of the following:
Debt securities as of December 31, 2001 consist of non-guaranteed bonds of "33,239 million ($25,065 thousand), foreign
currency notes of "49,538 million ($37,356 thousand), stock financial bonds of "123,237 million ($92,932 thousand) and
government bonds of "65 million ($49 thousand), which are all held-to-maturity and stated at cost.
Debt securities as of December 31, 2000 consist of convertible bonds of "33,903 million ($25,566 thousand), foreign currency
notes of "59,267 million ($44,693 thousand) and government bonds of "65 million ($49 thousand), which are all held-to-
maturity and stated at cost.
Finished goods and merchandise
Semi finished goods and work in process
Raw materials and supplies
Materials in transit
2001
$137,755
170,943
178,549
43,586
$530,833
2000
$381,759
188,074
134,327
66,844
$771,004
2000
"506,251
249,404
178,131
88,642
"
"1,022,428
2001
"182,677
226,688
236,773
57,799
"
"703,937
U.S. dollars (Note 2)
(in thousands)
Korean won
(in millions)
Equity securities accounted for using
the equity method
Marketable equity securities
Unlisted equity securities
Debt securities
2001
$2,333,751
96,995
138,452
155,402
$ 2,724,600
2000
$1,769,729
51,270
195,335
70,308
$ 2,086,642
2000
"#$%&'$(%(
')$*(*
#+*$,%&
*%$#%+
"
"2,767,096
2001
"%$,*&$)()
-#($'#+
-(%$',-
#,'$,)*
"
"3,613,092
U.S. dollars (Note 2)
(in thousands)
Korean won
(in millions)
N
OTES TO
N
ON
-C
ONSOLIDATED
F
INANCIAL
S
TATEMENTS
50
2001 Annual Report Hyundai Motor Company