Hyundai 2001 Annual Report Download - page 41
Download and view the complete annual report
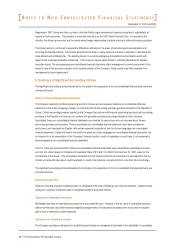
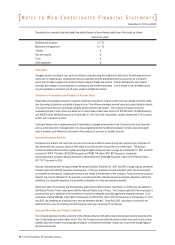
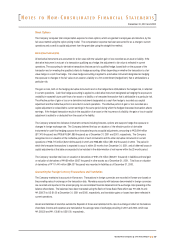
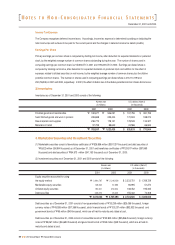
Please find page 41 of the 2001 Hyundai annual report below. You can navigate through the pages in the report by either clicking on the pages listed below, or by using the keyword search tool below to find specific information within the annual report.
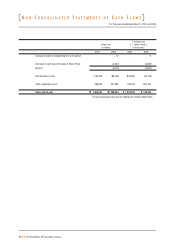
For the years ended december 31, 2001 and 2000
(continued)
Cash flows from investing activities:
Cash inflows from investing activities:
Proceeds from disposal of marketable securities
Reduction in other current assets
Proceeds from disposal of investments
Reduction in other assets
Proceeds from disposal of property, plant
and equipment
Proceeds from the sale of Motor Parts Division
Cash outflows from investing activities:
Purchase of short-term financial instruments
Acquisition of marketable securities
Additions to other current assets
Acquisition of investments
Additions to other assets
Acquisition of property, plant and equipment
Expenditures for development costs
Cash flows from financing activities:
Cash inflows from financing activities:
Proceeds from short-term borrowings
Proceeds from long-term debt
Proceeds from issuance of common stock
Increase in other long-term liabilities
Proceeds from disposal of treasury stock
Cash outflows from financing activities:
Repayment of short-term borrowings
Payment of cash dividends
Repayment of long-term debt
Purchase of treasury stock
Payment of stock issuance costs
2000
$ 226,031
1,571,727
240,387
560,697
31,546
336,643
2,967,031
(120,816)
(217,378)
(1,585,497)
(564,057)
(802,725)
(973,606)
(406,807)
(4,670,886)
(1,703,855)
2,614,719
993,944
324,950
56,909
-
3,990,522
(2,489,762)
(105,254)
(1,218,671)
(218,686)
(456)
(4,032,829)
(42,307)
2001
$ 115,078
698,641
490,228
337,960
17,892
-
1,659,799
(185,494)
(399,550)
(662,310)
(898,269)
(87,434)
(787,916)
(403,676)
(3,424,649)
(1,764,850)
2,466,459
1,431,838
-
2,032
175,668
4,075,997
(2,486,721)
(124,694)
(1,436,266)
(156)
-
(4,047,837)
28,160
2000
"299,740
2,084,267
318,777
743,540
41,833
446,422
3,934,579
(160,214)
(288,265)
(2,102,528)
(747,996)
(1,064,493)
(1,291,099)
(539,467)
(6,914,062)
(2,259,483)
3,467,379
1,318,069
430,916
75,467
-
5,291,831
(3,301,674)
(139,577)
(1,616,079)
(290,000)
(604)
(5,347,934)
(56,103)
2001
"152,605
926,468
650,091
448,169
23,727
-
2,201,060
(245,985)
(529,843)
(878,289)
(1,191,194)
(115,945)
(1,044,856)
(535,315)
(4,541,427)
(2,340,367)
3,270,772
1,898,760
-
2,695
232,954
5,405,181
(3,297,641)
(165,356)
(1,904,633)
(207)
-
(5,367,837)
37,344
Translation into
U. S. dollars (Note 2)
(in thousands)
Korean won
(in millions)
N
ON
-C
ONSOLIDATED
S
TATEMENTS OF
C
ASH
F
LOWS
41
2001 Annual ReportHyundai Motor Company


