Home Depot 2011 Annual Report Download - page 52
Download and view the complete annual report
Please find page 52 of the 2011 Home Depot annual report below. You can navigate through the pages in the report by either clicking on the pages listed below, or by using the keyword search tool below to find specific information within the annual report.-
 1
1 -
2
-
3
-
4
-
5
-
6
-
7
-
8
-
9
-
10
-
11
-
12
-
13
-
14
-
15
-
16
-
17
-
18
-
19
-
20
-
21
-
22
-
23
-
24
-
25
-
26
-
27
-
28
-
29
-
30
-
31
-
32
-
33
-
34
-
35
-
36
-
37
-
38
-
39
-
40
-
41
-
 42
42 -
 43
43 -
 44
44 -
 45
45 -
 46
46 -
 47
47 -
 48
48 -
 49
49 -
 50
50 -
 51
51 -
 52
52 -
 53
53 -
 54
54 -
 55
55 -
 56
56 -
 57
57 -
 58
58 -
 59
59 -
 60
60 -
 61
61 -
 62
62 -
63
-
64
-
65
-
66
-
67
-
68
 |
 |

46
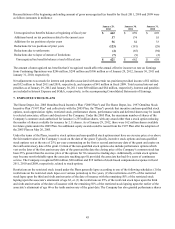
under the Plans, the payout of which is dependent on either (1) the Company’s total shareholder return percentile ranking
compared to the performance of individual companies included in the S&P 500 index at the end of the three-year
performance cycle, or (2) the Company’s performance against target average return on invested capital and operating profit
over a three-year performance cycle. Additionally, certain awards may become non-forfeitable upon the associate's attainment
of age 60, provided the associate has had five years of continuous service. The fair value of the restricted stock and
performance shares is expensed over the period during which the restrictions lapse. The Company recorded stock-based
compensation expense related to restricted stock and performance shares of $169 million, $167 million and $158 million in
fiscal 2011, 2010 and 2009, respectively.
In fiscal 2011, 2010 and 2009, there were an aggregate of 422 thousand, 479 thousand and 666 thousand deferred shares,
respectively, granted under the Plans. For associates, each deferred share entitles the individual to one share of common stock
to be received up to five years after the grant date of the deferred shares, subject to certain deferral rights of the associate.
Additionally, certain awards may become non-forfeitable upon the associate reaching age 60, provided the associate has had
five years of continuous service. The Company recorded stock-based compensation expense related to deferred shares of $12
million, $14 million and $14 million in fiscal 2011, 2010 and 2009, respectively.
As of January 29, 2012, there were 2 million non-qualified stock options outstanding under non-qualified stock option plans
that are not part of the Plans.
The Company maintains two Employee Stock Purchase Plans ("ESPPs") (U.S. and non-U.S. plans). The plan for
U.S. associates is a tax-qualified plan under Section 423 of the Internal Revenue Code. The non-U.S. plan is not a
Section 423 plan. As of January 29, 2012, there were 8 million shares available under the plan for U.S associates and 20
million shares available under the non-U.S. plan. The purchase price of shares under the ESPPs is equal to 85% of the stock’s
fair market value on the last day of the purchase period, which is a six-month period ending on December 31 and June 30 of
each year. During fiscal 2011, there were 2 million shares purchased under the ESPPs at an average price of $33.07. Under
the outstanding ESPPs as of January 29, 2012, employees have contributed $8 million to purchase shares at 85% of the
stock’s fair market value on the last day (June 30, 2012) of the current purchase period. The Company recognized $14
million, $13 million and $10 million of stock-based compensation expense in fiscal 2011, 2010 and 2009, respectively,
related to the ESPPs.
In total, the Company recorded stock-based compensation expense, including the expense of stock options, ESPP shares,
restricted stock, performance shares and deferred shares, of $215 million, $214 million and $201 million, in fiscal 2011, 2010
and 2009, respectively.
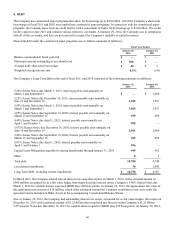
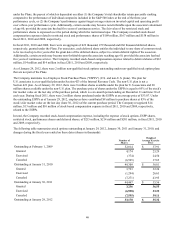
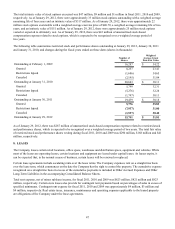
The following table summarizes stock options outstanding at January 29, 2012, January 30, 2011 and January 31, 2010, and
changes during the fiscal years ended on these dates (shares in thousands):
Outstanding at February 1, 2009
Granted
Exercised
Canceled
Outstanding at January 31, 2010
Granted
Exercised
Canceled
Outstanding at January 30, 2011
Granted
Exercised
Canceled
Outstanding at January 29, 2012
Number of
Shares
52,014
4,174
(374)
(6,505)
49,309
3,723
(1,294)
(7,271)
44,467
3,236
(6,938)
(7,595)
33,170
Weighted
Average Exercise
Price
$ 37.91
23.29
24.50
37.65
$ 36.81
32.24
26.63
43.95
$ 35.56
36.55
33.25
39.11
$ 35.32