Home Depot 2011 Annual Report Download - page 43
Download and view the complete annual report
Please find page 43 of the 2011 Home Depot annual report below. You can navigate through the pages in the report by either clicking on the pages listed below, or by using the keyword search tool below to find specific information within the annual report.-
 1
1 -
2
-
3
-
4
-
5
-
6
-
7
-
8
-
9
-
10
-
11
-
12
-
13
-
14
-
15
-
16
-
17
-
18
-
19
-
20
-
21
-
22
-
23
-
24
-
25
-
26
-
27
-
28
-
29
-
30
-
31
-
32
-
 33
33 -
 34
34 -
 35
35 -
 36
36 -
 37
37 -
 38
38 -
 39
39 -
 40
40 -
 41
41 -
 42
42 -
 43
43 -
 44
44 -
 45
45 -
 46
46 -
 47
47 -
 48
48 -
 49
49 -
 50
50 -
 51
51 -
 52
52 -
 53
53 -
54
-
55
-
56
-
57
-
58
-
59
-
60
-
61
-
62
-
63
-
64
-
65
-
66
-
67
-
68
 |
 |

37
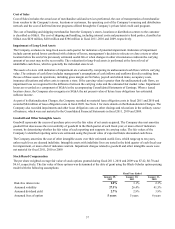
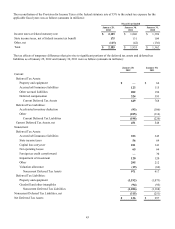
Cost of Sales
Cost of Sales includes the actual cost of merchandise sold and services performed, the cost of transportation of merchandise
from vendors to the Company’s stores, locations or customers, the operating cost of the Company’s sourcing and distribution
network and the cost of deferred interest programs offered through the Company’s private label credit card program.
The cost of handling and shipping merchandise from the Company’s stores, locations or distribution centers to the customer
is classified as SG&A. The cost of shipping and handling, including internal costs and payments to third parties, classified as
SG&A was $430 million, $410 million and $386 million in fiscal 2011, 2010 and 2009, respectively.
Impairment of Long-Lived Assets
The Company evaluates its long-lived assets each quarter for indicators of potential impairment. Indicators of impairment
include current period losses combined with a history of losses, management’s decision to relocate or close a store or other
location before the end of its previously estimated useful life or when changes in other circumstances indicate the carrying
amount of an asset may not be recoverable. The evaluation for long-lived assets is performed at the lowest level of
identifiable cash flows, which is generally the individual store level.
The assets of a store with indicators of impairment are evaluated by comparing its undiscounted cash flows with its carrying
value. The estimate of cash flows includes management’s assumptions of cash inflows and outflows directly resulting from
the use of those assets in operations, including gross margin on Net Sales, payroll and related items, occupancy costs,
insurance allocations and other costs to operate a store. If the carrying value is greater than the undiscounted cash flows, an
impairment loss is recognized for the difference between the carrying value and the estimated fair market value. Impairment
losses are recorded as a component of SG&A in the accompanying Consolidated Statements of Earnings. When a leased
location closes, the Company also recognizes in SG&A the net present value of future lease obligations less estimated
sublease income.
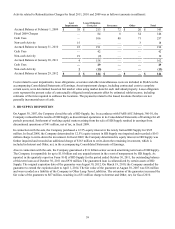
As part of its Rationalization Charges, the Company recorded no material lease obligation costs in fiscal 2011 and 2010 and
recorded $84 million of lease obligation costs in fiscal 2009. See Note 2 for more details on the Rationalization Charges. The
Company also recorded impairments and other lease obligation costs on other closings and relocations in the ordinary course
of business, which were not material to the Consolidated Financial Statements in fiscal 2011, 2010 and 2009.
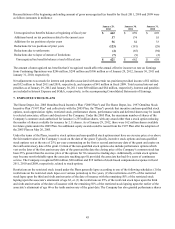
Goodwill and Other Intangible Assets
Goodwill represents the excess of purchase price over the fair value of net assets acquired. The Company does not amortize
goodwill but does assess the recoverability of goodwill in the third quarter of each fiscal year, or more often if indicators
warrant, by determining whether the fair value of each reporting unit supports its carrying value. The fair values of the
Company’s identified reporting units were estimated using the present value of expected future discounted cash flows.
The Company amortizes the cost of other intangible assets over their estimated useful lives, which range up to ten years,
unless such lives are deemed indefinite. Intangible assets with indefinite lives are tested in the third quarter of each fiscal year
for impairment, or more often if indicators warrant. Impairment charges related to goodwill and other intangible assets were
not material for fiscal 2011, 2010 or 2009.
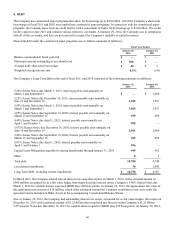
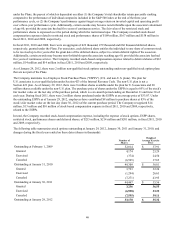
Stock-Based Compensation
The per share weighted average fair value of stock options granted during fiscal 2011, 2010 and 2009 was $7.42, $6.70 and
$6.61, respectively. The fair value of these options was determined at the date of grant using the Black-Scholes option-pricing
model with the following assumptions:
Risk-free interest rate
Assumed volatility
Assumed dividend yield
Assumed lives of option
Fiscal Year Ended
January 29,
2012
2.0%
27.3%
2.7%
5 years
January 30,
2011
3.1%
26.4%
2.9%
5 years
January 31,
2010
2.3%
41.5%
3.9%
6 years