Home Depot 2011 Annual Report Download - page 29
Download and view the complete annual report
Please find page 29 of the 2011 Home Depot annual report below. You can navigate through the pages in the report by either clicking on the pages listed below, or by using the keyword search tool below to find specific information within the annual report.-
 1
1 -
2
-
3
-
4
-
5
-
6
-
7
-
8
-
9
-
10
-
11
-
12
-
13
-
14
-
15
-
16
-
17
-
18
-
 19
19 -
 20
20 -
 21
21 -
 22
22 -
 23
23 -
 24
24 -
 25
25 -
 26
26 -
 27
27 -
 28
28 -
 29
29 -
 30
30 -
 31
31 -
 32
32 -
 33
33 -
 34
34 -
 35
35 -
 36
36 -
 37
37 -
 38
38 -
 39
39 -
40
-
41
-
42
-
43
-
44
-
45
-
46
-
47
-
48
-
49
-
50
-
51
-
52
-
53
-
54
-
55
-
56
-
57
-
58
-
59
-
60
-
61
-
62
-
63
-
64
-
65
-
66
-
67
-
68
 |
 |

23
Off-Balance Sheet Arrangements
In accordance with generally accepted accounting principles, operating leases for a portion of our real estate and other assets
are not reflected in our Consolidated Balance Sheets.
Contractual Obligations
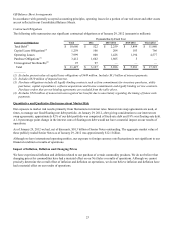
The following table summarizes our significant contractual obligations as of January 29, 2012 (amounts in millions):
Contractual Obligations
Total Debt(1)
Capital Lease Obligations(2)
Operating Leases
Purchase Obligations(3)
Unrecognized Tax Benefits(4)
Total
Payments Due by Fiscal Year
Total
$ 18,660
1,259
7,999
3,412
97
$ 31,427
2012
$ 522
106
800
1,602
97
$ 3,127
2013-2014
$ 2,259
204
1,428
1,805
—
$ 5,696
2015-2016
$ 3,899
183
1,194
5
—
$ 5,281
Thereafter
$ 11,980
766
4,577
—
—
$ 17,323
—————
(1) Excludes present value of capital lease obligations of $449 million. Includes $8.3 billion of interest payments.
(2) Includes $810 million of imputed interest.
(3) Purchase obligations include all legally binding contracts such as firm commitments for inventory purchases, utility
purchases, capital expenditures, software acquisitions and license commitments and legally binding service contracts.
Purchase orders that are not binding agreements are excluded from the table above.
(4) Excludes $524 million of noncurrent unrecognized tax benefits due to uncertainty regarding the timing of future cash
payments.
Quantitative and Qualitative Disclosures about Market Risk
Our exposure to market risk results primarily from fluctuations in interest rates. Interest rate swap agreements are used, at
times, to manage our fixed/floating rate debt portfolio. At January 29, 2012, after giving consideration to our interest rate
swap agreements, approximately 82% of our debt portfolio was comprised of fixed-rate debt and 18% was floating-rate debt.
A 1.0 percentage point change in the interest costs of floating-rate debt would not have a material impact on our results of
operations.
As of January 29, 2012 we had, net of discounts, $10.3 billion of Senior Notes outstanding. The aggregate market value of
these publicly traded Senior Notes as of January 29, 2012 was approximately $12.1 billion.
Although we have international operating entities, our exposure to foreign currency rate fluctuations is not significant to our
financial condition or results of operations.
Impact of Inflation, Deflation and Changing Prices
We have experienced inflation and deflation related to our purchase of certain commodity products. We do not believe that
changing prices for commodities have had a material effect on our Net Sales or results of operations. Although we cannot
precisely determine the overall effect of inflation and deflation on operations, we do not believe inflation and deflation have
had a material effect on our results of operations.