Home Depot 2011 Annual Report Download - page 39
Download and view the complete annual report
Please find page 39 of the 2011 Home Depot annual report below. You can navigate through the pages in the report by either clicking on the pages listed below, or by using the keyword search tool below to find specific information within the annual report.-
 1
1 -
2
-
3
-
4
-
5
-
6
-
7
-
8
-
9
-
10
-
11
-
12
-
13
-
14
-
15
-
16
-
17
-
18
-
19
-
20
-
21
-
22
-
23
-
24
-
25
-
26
-
27
-
28
-
 29
29 -
 30
30 -
 31
31 -
 32
32 -
 33
33 -
 34
34 -
 35
35 -
 36
36 -
 37
37 -
 38
38 -
 39
39 -
 40
40 -
 41
41 -
 42
42 -
 43
43 -
 44
44 -
 45
45 -
 46
46 -
 47
47 -
 48
48 -
 49
49 -
50
-
51
-
52
-
53
-
54
-
55
-
56
-
57
-
58
-
59
-
60
-
61
-
62
-
63
-
64
-
65
-
66
-
67
-
68
 |
 |

33
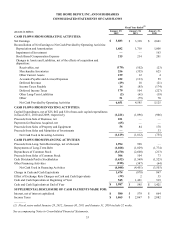
THE HOME DEPOT, INC. AND SUBSIDIARIES
CONSOLIDATED STATEMENTS OF CASH FLOWS
amounts in millions
CASH FLOWS FROM OPERATING ACTIVITIES:
Net Earnings
Reconciliation of Net Earnings to Net Cash Provided by Operating Activities:
Depreciation and Amortization
Impairment of Investment
Stock-Based Compensation Expense
Changes in Assets and Liabilities, net of the effects of acquisition and
disposition:
Receivables, net
Merchandise Inventories
Other Current Assets
Accounts Payable and Accrued Expenses
Deferred Revenue
Income Taxes Payable
Deferred Income Taxes
Other Long-Term Liabilities
Other
Net Cash Provided by Operating Activities
CASH FLOWS FROM INVESTING ACTIVITIES:
Capital Expenditures, net of $25, $62 and $10 of non-cash capital expenditures
in fiscal 2011, 2010 and 2009, respectively
Proceeds from Sale of Business, net
Payments for Business Acquired, net
Proceeds from Sales of Property and Equipment
Proceeds from Sales and Maturities of Investments
Net Cash Used in Investing Activities
CASH FLOWS FROM FINANCING ACTIVITIES:
Proceeds from Long-Term Borrowings, net of discount
Repayments of Long-Term Debt
Repurchases of Common Stock
Proceeds from Sales of Common Stock
Cash Dividends Paid to Stockholders
Other Financing Activities
Net Cash Used in Financing Activities
Change in Cash and Cash Equivalents
Effect of Exchange Rate Changes on Cash and Cash Equivalents
Cash and Cash Equivalents at Beginning of Year
Cash and Cash Equivalents at End of Year
SUPPLEMENTAL DISCLOSURE OF CASH PAYMENTS MADE FOR:
Interest, net of interest capitalized
Income Taxes
Fiscal Year Ended(1)
January 29,
2012
$ 3,883
1,682
—
215
(170)
256
159
422
(29)
14
170
(2)
51
6,651
(1,221)
101
(65)
56
—
(1,129)
1,994
(1,028)
(3,470)
306
(1,632)
(218)
(4,048)
1,474
(32)
545
$ 1,987
$ 580
$ 1,865
January 30,
2011
$ 3,338
1,718
—
214
(102)
(355)
12
(133)
10
(85)
104
(61)
(75)
4,585
(1,096)
—
—
84
—
(1,012)
998
(1,029)
(2,608)
104
(1,569)
(347)
(4,451)
(878)
2
1,421
$ 545
$ 579
$ 2,067
January 31,
2010
$ 2,661
1,806
163
201
(23)
625
4
59
(21)
(174)
(227)
(19)
70
5,125
(966)
—
—
178
33
(755)
—
(1,774)
(213)
73
(1,525)
(64)
(3,503)
867
35
519
$ 1,421
$ 664
$ 2,082
—————
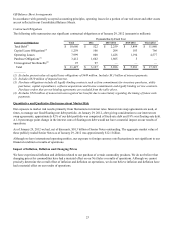
(1) Fiscal years ended January 29, 2012, January 30, 2011 and January 31, 2010 include 52 weeks.
See accompanying Notes to Consolidated Financial Statements.