Home Depot 2011 Annual Report Download - page 37
Download and view the complete annual report
Please find page 37 of the 2011 Home Depot annual report below. You can navigate through the pages in the report by either clicking on the pages listed below, or by using the keyword search tool below to find specific information within the annual report.-
 1
1 -
2
-
3
-
4
-
5
-
6
-
7
-
8
-
9
-
10
-
11
-
12
-
13
-
14
-
15
-
16
-
17
-
18
-
19
-
20
-
21
-
22
-
23
-
24
-
25
-
26
-
 27
27 -
 28
28 -
 29
29 -
 30
30 -
 31
31 -
 32
32 -
 33
33 -
 34
34 -
 35
35 -
 36
36 -
 37
37 -
 38
38 -
 39
39 -
 40
40 -
 41
41 -
 42
42 -
 43
43 -
 44
44 -
 45
45 -
 46
46 -
 47
47 -
48
-
49
-
50
-
51
-
52
-
53
-
54
-
55
-
56
-
57
-
58
-
59
-
60
-
61
-
62
-
63
-
64
-
65
-
66
-
67
-
68
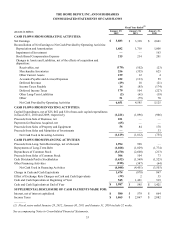
 |
 |

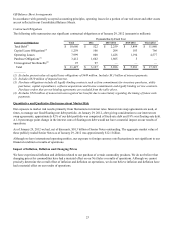
31
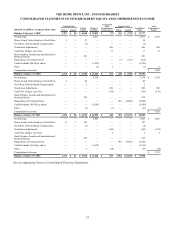
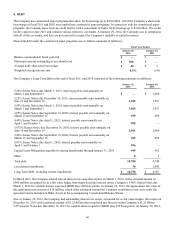
THE HOME DEPOT, INC. AND SUBSIDIARIES
CONSOLIDATED BALANCE SHEETS
amounts in millions, except share and per share data
ASSETS
Current Assets:
Cash and Cash Equivalents
Receivables, net
Merchandise Inventories
Other Current Assets
Total Current Assets
Property and Equipment, at cost:
Land
Buildings
Furniture, Fixtures and Equipment
Leasehold Improvements
Construction in Progress
Capital Leases
Less Accumulated Depreciation and Amortization
Net Property and Equipment
Notes Receivable
Goodwill
Other Assets
Total Assets
LIABILITIES AND STOCKHOLDERS’ EQUITY
Current Liabilities:
Accounts Payable
Accrued Salaries and Related Expenses
Sales Taxes Payable
Deferred Revenue
Income Taxes Payable
Current Installments of Long-Term Debt
Other Accrued Expenses
Total Current Liabilities
Long-Term Debt, excluding current installments
Other Long-Term Liabilities
Deferred Income Taxes
Total Liabilities
STOCKHOLDERS’ EQUITY
Common Stock, par value $0.05; authorized: 10 billion shares; issued: 1.733 billion
shares at January 29, 2012 and 1.722 billion shares at January 30, 2011; outstanding:
1.537 billion shares at January 29, 2012 and 1.623 billion shares at January 30, 2011
Paid-In Capital
Retained Earnings
Accumulated Other Comprehensive Income
Treasury Stock, at cost, 196 million shares at January 29, 2012 and 99 million shares at
January 30, 2011
Total Stockholders’ Equity
Total Liabilities and Stockholders’ Equity
January 29,
2012
$ 1,987
1,245
10,325
963
14,520
8,480
17,737
10,040
1,372
758
588
38,975
14,527
24,448
135
1,120
295
$ 40,518
$ 4,856
1,372
391
1,147
23
30
1,557
9,376
10,758
2,146
340
22,620
87
6,966
17,246
293
(6,694)
17,898
$ 40,518
January 30,
2011
$ 545
1,085
10,625
1,224
13,479
8,497
17,606
9,687
1,373
654
568
38,385
13,325
25,060
139
1,187
260
$ 40,125
$ 4,717
1,290
368
1,177
13
1,042
1,515
10,122
8,707
2,135
272
21,236
86
6,556
14,995
445
(3,193)
18,889
$ 40,125
See accompanying Notes to Consolidated Financial Statements.