Home Depot 2011 Annual Report Download - page 26
Download and view the complete annual report
Please find page 26 of the 2011 Home Depot annual report below. You can navigate through the pages in the report by either clicking on the pages listed below, or by using the keyword search tool below to find specific information within the annual report.-
 1
1 -
2
-
3
-
4
-
5
-
6
-
7
-
8
-
9
-
10
-
11
-
12
-
13
-
14
-
15
-
 16
16 -
 17
17 -
 18
18 -
 19
19 -
 20
20 -
 21
21 -
 22
22 -
 23
23 -
 24
24 -
 25
25 -
 26
26 -
 27
27 -
 28
28 -
 29
29 -
 30
30 -
 31
31 -
 32
32 -
 33
33 -
 34
34 -
 35
35 -
 36
36 -
37
-
38
-
39
-
40
-
41
-
42
-
43
-
44
-
45
-
46
-
47
-
48
-
49
-
50
-
51
-
52
-
53
-
54
-
55
-
56
-
57
-
58
-
59
-
60
-
61
-
62
-
63
-
64
-
65
-
66
-
67
-
68
 |
 |

20
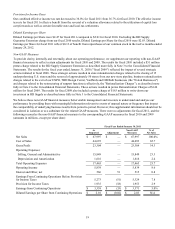
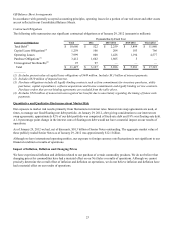
Non-GAAP Measures (continued):
Net Sales
Cost of Sales
Gross Profit
Operating Expenses:
Selling, General and Administrative
Depreciation and Amortization
Total Operating Expenses
Operating Income
Interest and Other, net
Earnings From Continuing Operations Before Provision
for Income Taxes
Provision for Income Taxes
Earnings from Continuing Operations
Diluted Earnings per Share from Continuing Operations
Fiscal Year Ended January 31, 2010
As
Reported
$ 66,176
43,764
22,412
15,902
1,707
17,609
4,803
821
3,982
1,362
$ 2,620
$ 1.55
Adjustments
$ 221
193
28
170
4
174
(146)
163
(309)
(118)
$(191)
$(0.11)
Non-GAAP
Measures
$ 65,955
43,571
22,384
15,732
1,703
17,435
4,949
658
4,291
1,480
$ 2,811
$ 1.66
% of
Net Sales
100.0%
66.1
33.9
23.9
2.6
26.4
7.5
1.0
6.5
2.2
4.3%
N/A
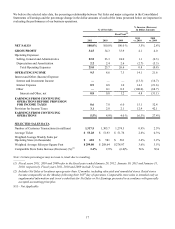
Fiscal 2010 Compared to Fiscal 2009
Net Sales
Net Sales for fiscal 2010 increased 2.8% to $68.0 billion from $66.2 billion for fiscal 2009. The increase in Net Sales for
fiscal 2010 reflects the impact of positive comparable store sales. Total comparable store sales increased 2.9% for fiscal 2010
compared to a decrease of 6.6% for fiscal 2009.
The increase in comparable store sales for fiscal 2010 reflects a number of factors. We experienced positive comparable store
sales in 12 of our 14 departments for fiscal 2010. Comparable store sales for our Lumber, Tools, Electrical, Indoor Garden,
Outdoor Garden and Kitchen product categories were above the Company average for fiscal 2010. The increase in
comparable store sales also reflects a 2.4% increase in our comparable store customer transactions and a 0.5% increase in our
comparable store average ticket.
Gross Profit
Gross Profit increased 4.0% to $23.3 billion for fiscal 2010 from $22.4 billion for fiscal 2009. Gross Profit as a percent of
Net Sales was 34.3% for fiscal 2010 compared to 33.9% for fiscal 2009, an increase of 40 basis points. Our U.S. stores
experienced gross profit margin expansion in fiscal 2010 as we realized benefits from better product assortment management
through our portfolio approach and leveraging of our newly developed merchandising tools. Lower levels of clearance
inventory in our stores for fiscal 2010 compared to fiscal 2009 also contributed to this expansion. Additionally, we realized
gross profit margin expansion from our non-U.S. businesses, primarily Canada, due primarily to a change in the mix of
products sold.
Operating Expenses
SG&A decreased 0.3% to $15.8 billion for fiscal 2010 from $15.9 billion for fiscal 2009. As a percent of Net Sales, SG&A
was 23.3% for fiscal 2010 compared to 24.0% for fiscal 2009. Excluding the Rationalization Charges, SG&A as a percent of
Net Sales was 23.9% for fiscal 2009. The decrease in SG&A as a percent of Net Sales for fiscal 2010 reflects expense
leverage in the positive comparable store sales environment and lower payroll and other expenses.
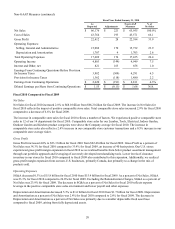
Depreciation and Amortization decreased 5.3% to $1.6 billion for fiscal 2010 from $1.7 billion for fiscal 2009. Depreciation
and Amortization as a percent of Net Sales was 2.4% for fiscal 2010 compared to 2.6% for fiscal 2009. The decrease in
Depreciation and Amortization as a percent of Net Sales was primarily due to a smaller depreciable fixed asset base
compared to fiscal 2009, arising from fully depreciated assets.