Home Depot 2011 Annual Report Download - page 27
Download and view the complete annual report
Please find page 27 of the 2011 Home Depot annual report below. You can navigate through the pages in the report by either clicking on the pages listed below, or by using the keyword search tool below to find specific information within the annual report.-
 1
1 -
2
-
3
-
4
-
5
-
6
-
7
-
8
-
9
-
10
-
11
-
12
-
13
-
14
-
15
-
16
-
 17
17 -
 18
18 -
 19
19 -
 20
20 -
 21
21 -
 22
22 -
 23
23 -
 24
24 -
 25
25 -
 26
26 -
 27
27 -
 28
28 -
 29
29 -
 30
30 -
 31
31 -
 32
32 -
 33
33 -
 34
34 -
 35
35 -
 36
36 -
 37
37 -
38
-
39
-
40
-
41
-
42
-
43
-
44
-
45
-
46
-
47
-
48
-
49
-
50
-
51
-
52
-
53
-
54
-
55
-
56
-
57
-
58
-
59
-
60
-
61
-
62
-
63
-
64
-
65
-
66
-
67
-
68
 |
 |

21
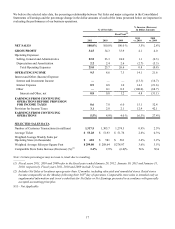
Operating Income
Operating Income increased 21.6% to $5.8 billion for fiscal 2010 from $4.8 billion for fiscal 2009. Operating Income as a
percent of Net Sales was 8.6% for fiscal 2010 compared to 7.3% for fiscal 2009. Excluding the Rationalization Charges from
the results of fiscal 2009, Operating Income increased 18.0% for fiscal 2010.
Interest and Other, net
In fiscal 2010, we recognized $566 million of Interest and Other, net, compared to $821 million for fiscal 2009. Interest and
Other, net, as a percent of Net Sales was 0.8% for fiscal 2010 compared to 1.2% for fiscal 2009. Interest and Other, net,
reflects a $51 million charge in fiscal 2010 related to the HD Supply Guarantee Extension and a $163 million charge in fiscal
2009 to write-down our investment in HD Supply. Excluding these charges, Interest and Other, net, as a percent of Net Sales
was 0.8% for fiscal 2010 compared to 1.0% for fiscal 2009. This decrease was primarily due to a $44 million benefit arising
from favorable IRS guidance resulting in the reversal of an interest accrual during fiscal 2010, a lower cost of outstanding
indebtedness than fiscal 2009 and an interest benefit arising from certain state income tax settlements.
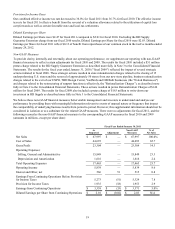
Provision for Income Taxes
Our combined effective income tax rate for continuing operations increased to 36.7% for fiscal 2010 from 34.2% for fiscal
2009. The effective income tax rate for fiscal 2009 included benefits arising from a favorable foreign tax settlement and a
realignment of our foreign corporate structure.
Diluted Earnings per Share from Continuing Operations
Diluted Earnings per Share from Continuing Operations were $2.01 for fiscal 2010 and $1.55 for fiscal 2009. Excluding the
HD Supply Guarantee Extension charge from our fiscal 2010 results, and the Rationalization Charges and the write-down of
our investment in HD Supply from our fiscal 2009 results, Diluted Earnings per Share from Continuing Operations for fiscal
2010 were $2.03 compared to $1.66 for fiscal 2009, an increase of 22.3%. Diluted Earnings per Share from Continuing
Operations for fiscal 2010 reflect $0.04 of benefit from repurchases of our common stock.
Discontinued Operations
On August 30, 2007, we closed the sale of HD Supply. Discontinued operations for fiscal 2009 consist of earnings of
$41 million, net of tax, or $0.02 per diluted share, for the settlement of working capital matters arising from the sale of HD
Supply.
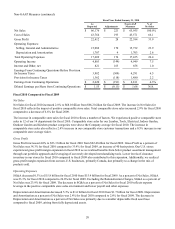
Liquidity and Capital Resources
Cash flow generated from operations provides us with a significant source of liquidity. For fiscal 2011, Net Cash Provided by
Operating Activities was $6.7 billion compared to $4.6 billion for fiscal 2010. This increase was primarily a result of an
increase in Net Earnings, changes in inventory levels and other net working capital items.
Net Cash Used in Investing Activities for fiscal 2011 was $1.1 billion compared to $1.0 billion for fiscal 2010. This change
was primarily due to increased Capital Expenditures and Payments for Business Acquired related to the purchase of an online
home services platform, partially offset by Proceeds from Sale of Business related to the sale of a non-core carpet cleaning
and cabinet refinishing business. In fiscal 2011, we spent $1.2 billion on Capital Expenditures, allocated as follows: 35% for
core technology, 17% for maintenance, 17% for merchandising and operations, 11% for new stores and 20% for other
initiatives.
Net Cash Used in Financing Activities for fiscal 2011 was $4.0 billion compared to $4.5 billion for fiscal 2010. In March
2011, we issued $1.0 billion of 4.40% Senior Notes due April 1, 2021 at a discount of $2 million and $1.0 billion of 5.95%
Senior Notes due April 1, 2041 at a discount of $4 million (together, the "March 2011 issuance"). Interest on these Senior
Notes is due semi-annually on April 1 and October 1 of each year, beginning October 1, 2011. The net proceeds of the March
2011 issuance were used to repurchase $1.0 billion of our common stock under an Accelerated Share Repurchase ("ASR")
agreement, and the balance of the net proceeds was used to repay our 5.20% Senior Notes that matured March 1, 2011 in the
aggregate principal amount of $1.0 billion.
In connection with the March 2011 issuance, we entered into an ASR agreement with a third-party financial institution to
repurchase $1.0 billion of our common stock. Under the agreement, we paid $1.0 billion to the financial institution and
received a total of 27 million shares in fiscal 2011. Also in fiscal 2011, we repurchased an additional 70 million shares of our
common stock for $2.5 billion through the open market. Since the inception of our share repurchase program in 2002, we