Home Depot 2011 Annual Report Download - page 49
Download and view the complete annual report
Please find page 49 of the 2011 Home Depot annual report below. You can navigate through the pages in the report by either clicking on the pages listed below, or by using the keyword search tool below to find specific information within the annual report.-
 1
1 -
2
-
3
-
4
-
5
-
6
-
7
-
8
-
9
-
10
-
11
-
12
-
13
-
14
-
15
-
16
-
17
-
18
-
19
-
20
-
21
-
22
-
23
-
24
-
25
-
26
-
27
-
28
-
29
-
30
-
31
-
32
-
33
-
34
-
35
-
36
-
37
-
38
-
 39
39 -
 40
40 -
 41
41 -
 42
42 -
 43
43 -
 44
44 -
 45
45 -
 46
46 -
 47
47 -
 48
48 -
 49
49 -
 50
50 -
 51
51 -
 52
52 -
 53
53 -
 54
54 -
 55
55 -
 56
56 -
 57
57 -
 58
58 -
 59
59 -
60
-
61
-
62
-
63
-
64
-
65
-
66
-
67
-
68
 |
 |

43
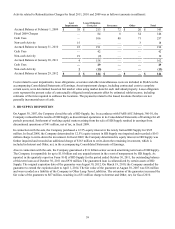
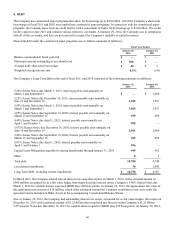
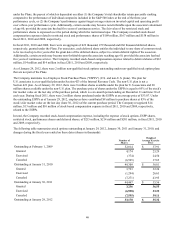
The reconciliation of the Provision for Income Taxes at the federal statutory rate of 35% to the actual tax expense for the
applicable fiscal years was as follows (amounts in millions):
Income taxes at federal statutory rate
State income taxes, net of federal income tax benefit
Other, net
Total
Fiscal Year Ended
January 29,
2012
$ 2,125
175
(115)
$ 2,185
January 30,
2011
$ 1,846
131
(42)
$ 1,935
January 31,
2010
$ 1,394
104
(136)
$ 1,362
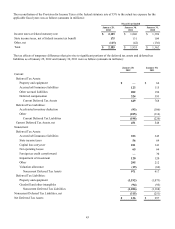
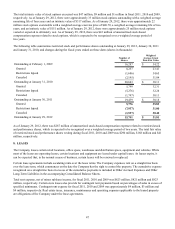
The tax effects of temporary differences that give rise to significant portions of the deferred tax assets and deferred tax
liabilities as of January 29, 2012 and January 30, 2011 were as follows (amounts in millions):
Current:
Deferred Tax Assets:
Property and equipment
Accrued self-insurance liabilities
Other accrued liabilities
Deferred compensation
Current Deferred Tax Assets
Deferred Tax Liabilities:
Accelerated inventory deduction
Other
Current Deferred Tax Liabilities
Current Deferred Tax Assets, net
Noncurrent:
Deferred Tax Assets:
Accrued self-insurance liabilities
State income taxes
Capital loss carryover
Net operating losses
Foreign tax credit carryforward
Impairment of investment
Other
Valuation allowance
Noncurrent Deferred Tax Assets
Deferred Tax Liabilities:
Property and equipment
Goodwill and other intangibles
Noncurrent Deferred Tax Liabilities
Noncurrent Deferred Tax Liabilities, net
Net Deferred Tax Assets
January 29,
2012
$—
123
202
324
649
(93)
(105)
(198)
451
353
56
101
65
—
120
295
(19)
971
(1,192)
(94)
(1,286)
(315)
$ 136
January 30,
2011
$64
115
196
393
768
(106)
(114)
(220)
548
345
69
141
66
30
120
212
(66)
917
(1,073)
(95)
(1,168)
(251)
$ 297