Home Depot 2011 Annual Report Download - page 25
Download and view the complete annual report
Please find page 25 of the 2011 Home Depot annual report below. You can navigate through the pages in the report by either clicking on the pages listed below, or by using the keyword search tool below to find specific information within the annual report.-
 1
1 -
2
-
3
-
4
-
5
-
6
-
7
-
8
-
9
-
10
-
11
-
12
-
13
-
14
-
 15
15 -
 16
16 -
 17
17 -
 18
18 -
 19
19 -
 20
20 -
 21
21 -
 22
22 -
 23
23 -
 24
24 -
 25
25 -
 26
26 -
 27
27 -
 28
28 -
 29
29 -
 30
30 -
 31
31 -
 32
32 -
 33
33 -
 34
34 -
 35
35 -
36
-
37
-
38
-
39
-
40
-
41
-
42
-
43
-
44
-
45
-
46
-
47
-
48
-
49
-
50
-
51
-
52
-
53
-
54
-
55
-
56
-
57
-
58
-
59
-
60
-
61
-
62
-
63
-
64
-
65
-
66
-
67
-
68
 |
 |

19
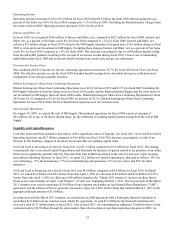
Provision for Income Taxes
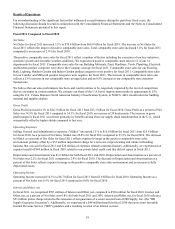
Our combined effective income tax rate decreased to 36.0% for fiscal 2011 from 36.7% for fiscal 2010. The effective income
tax rate for fiscal 2011 reflects a benefit from the reversal of a valuation allowance related to the utilization of capital loss
carryforwards as well as certain favorable state and local tax settlements.
Diluted Earnings per Share
Diluted Earnings per Share were $2.47 for fiscal 2011 compared to $2.01 for fiscal 2010. Excluding the HD Supply
Guarantee Extension charge from our fiscal 2010 results, Diluted Earnings per Share for fiscal 2010 were $2.03. Diluted
Earnings per Share for fiscal 2011 reflect $0.13 of benefit from repurchases of our common stock in the twelve months ended
January 29, 2012.
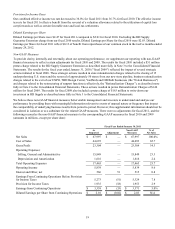
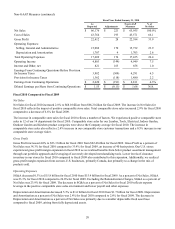
Non-GAAP Measures
To provide clarity, internally and externally, about our operating performance, we supplement our reporting with non-GAAP
financial measures to reflect certain adjustments for fiscal 2010 and 2009. The results for fiscal 2010 included a $51 million
pretax charge related to the HD Supply Guarantee Extension as described more fully in Note 3 to the Consolidated Financial
Statements. The results for the fiscal year ended January 31, 2010 ("fiscal 2009") reflected the impact of several strategic
actions initiated in fiscal 2008. These strategic actions resulted in store rationalization charges related to the closing of 15
underperforming U.S. stores and the removal of approximately 50 stores from our new store pipeline, business rationalization
charges related to the exit of our EXPO, THD Design Center, Yardbirds and HD Bath businesses (the "Exited Businesses")
and charges related to the restructuring of support functions (collectively, the "Rationalization Charges"), as described more
fully in Note 2 to the Consolidated Financial Statements. These actions resulted in pretax Rationalization Charges of $146
million for fiscal 2009. The results for fiscal 2009 also included a pretax charge of $163 million to write-down our
investment in HD Supply as described more fully in Note 3 to the Consolidated Financial Statements.
We believe these non-GAAP financial measures better enable management and investors to understand and analyze our
performance by providing them with meaningful information relevant to events of unusual nature or frequency that impact
the comparability of underlying business results from period to period. However, this supplemental information should not be
considered in isolation or as a substitute for the related GAAP measures. There were no adjustments for fiscal 2011, and the
following reconciles the non-GAAP financial measures to the corresponding GAAP measures for fiscal 2010 and 2009
(amounts in millions, except per share data):
Net Sales
Cost of Sales
Gross Profit
Operating Expenses:
Selling, General and Administrative
Depreciation and Amortization
Total Operating Expenses
Operating Income
Interest and Other, net
Earnings From Continuing Operations Before Provision
for Income Taxes
Provision for Income Taxes
Earnings from Continuing Operations
Diluted Earnings per Share from Continuing Operations
Fiscal Year Ended January 30, 2011
As
Reported
$ 67,997
44,693
23,304
15,849
1,616
17,465
5,839
566
5,273
1,935
$ 3,338
$ 2.01
Adjustment
$—
—
—
—
—
—
—
51
(51)
(18)
$(33)
$(0.02)
Non-GAAP
Measures
$ 67,997
44,693
23,304
15,849
1,616
17,465
5,839
515
5,324
1,953
$ 3,371
$ 2.03
% of
Net Sales
100.0%
65.7
34.3
23.3
2.4
25.7
8.6
0.8
7.8
2.9
5.0%
N/A