Home Depot 2011 Annual Report Download - page 22
Download and view the complete annual report
Please find page 22 of the 2011 Home Depot annual report below. You can navigate through the pages in the report by either clicking on the pages listed below, or by using the keyword search tool below to find specific information within the annual report.-
 1
1 -
2
-
3
-
4
-
5
-
6
-
7
-
8
-
9
-
10
-
11
-
 12
12 -
 13
13 -
 14
14 -
 15
15 -
 16
16 -
 17
17 -
 18
18 -
 19
19 -
 20
20 -
 21
21 -
 22
22 -
 23
23 -
 24
24 -
 25
25 -
 26
26 -
 27
27 -
 28
28 -
 29
29 -
 30
30 -
 31
31 -
 32
32 -
33
-
34
-
35
-
36
-
37
-
38
-
39
-
40
-
41
-
42
-
43
-
44
-
45
-
46
-
47
-
48
-
49
-
50
-
51
-
52
-
53
-
54
-
55
-
56
-
57
-
58
-
59
-
60
-
61
-
62
-
63
-
64
-
65
-
66
-
67
-
68
 |
 |

16
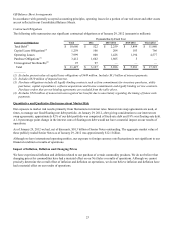
Item 7. Management’s Discussion and Analysis of Financial Condition and Results of Operations.
Executive Summary and Selected Consolidated Statements of Earnings Data
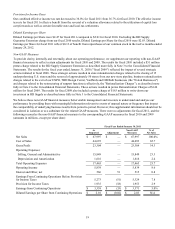
For the fiscal year ended January 29, 2012 ("fiscal 2011"), we reported Net Earnings of $3.9 billion and Diluted Earnings per
Share of $2.47 compared to Net Earnings of $3.3 billion and Diluted Earnings per Share of $2.01 for the fiscal year ended
January 30, 2011 ("fiscal 2010").
Net Sales increased 3.5% to $70.4 billion for fiscal 2011 from $68.0 billion for fiscal 2010. Our comparable store sales
increased 3.4% in fiscal 2011, driven primarily by a 2.6% increase in our comparable store average ticket. Comparable store
sales for our U.S. stores increased 3.0% in fiscal 2011.
In fiscal 2011, we continued to focus on the following four key initiatives:
Customer Service – Our focus on customer service is anchored on the principles of putting customers first, taking care of our
associates and simplifying the business. In fiscal 2011, we rolled out a new scheduling system for our associates and a new
centralized return to vendor process. As a result, we now have approximately 53% of our store labor hours dedicated to
customer-facing activity. We have a customer-facing store payroll target of 60%, and we believe we will achieve that goal by
2013. Also in fiscal 2011, we began the process of rolling out in-store repair services for power equipment and power tools,
and we believe this will be a significant improvement in convenience for our customers.
Product Authority – Our focus on product authority is facilitated by our merchandising transformation and portfolio strategy,
including innovation, assortment and value. We are enhancing our special order system and when completed, this system will
make the special order process both simpler and more accurate for our customers and associates. As part of this multi-phased
project to improve our special order performance, we digitized our vendor catalogs in fiscal 2011. We also continued to form
strategic alliances and relationships with selected suppliers to bring a number of proprietary and exclusive brands across a
wide range of departments in fiscal 2011.
Productivity and Efficiency – Our approach to driving productivity and efficiency is advanced through building best-in-class
competitive advantages in information technology and supply chain, as well as building shareholder value through higher
returns on invested capital and total value returned to shareholders in the form of dividends and share repurchases. In fiscal
2011, we saw continued benefits from our supply chain investments, which improved our in-stock rate and asset efficiency.
Our inventory turnover ratio was 4.3 times at the end of fiscal 2011 compared to 4.1 times at the end of fiscal 2010.
Additionally, as of the end of fiscal 2011, we handled approximately 70% of our U.S. Cost of Sales through centralized
distribution compared to approximately 25% four years ago.
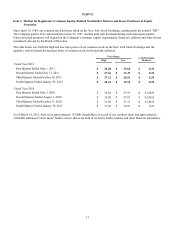
In terms of building shareholder value, we repurchased a total of 97 million shares for $3.5 billion during fiscal 2011. In
addition, in November 2011 we announced a 16% increase in our quarterly cash dividend to 29 cents per share.
Interconnected Retail – Our focus on interconnected retail is based on the view that providing a seamless shopping
experience across multiple channels will be a critical enabler for future success. Our multiple channel focus is allowing us to
greatly expand our assortment of merchandise, and we are making the investment to build these capabilities, including the
roll out of Buy On-Line, Pick-up In Store ("BOPIS"), which we completed in fiscal 2011. In February 2012, we rolled out a
significant upgrade of our website, which enhances the layout, visual appearance and responsiveness of the site.
We opened 11 new stores, including two relocations, and closed five stores in fiscal 2011, bringing our total store count at the
end of fiscal 2011 to 2,252. As of the end of fiscal 2011, a total of 278 of these stores, or 12.3%, were located in Canada,
Mexico and China compared to 272 stores, or 12.1%, at the end of fiscal 2010.
We generated $6.7 billion of cash flow from operations in fiscal 2011. We used a portion of this cash flow to fund $2.5 billion
of the total $3.5 billion of share repurchases, pay $1.6 billion of dividends and fund $1.2 billion in capital expenditures.
At the end of fiscal 2011, our long-term debt-to-equity ratio increased to 60.1% from 46.1% at the end of fiscal 2010 driven
primarily by higher debt levels. Our return on invested capital (computed on net operating profit after tax for the trailing
twelve months and the average of beginning and ending long-term debt and equity) was 14.9% for fiscal 2011 compared to
12.8% for fiscal 2010.