Home Depot 2011 Annual Report Download - page 24
Download and view the complete annual report
Please find page 24 of the 2011 Home Depot annual report below. You can navigate through the pages in the report by either clicking on the pages listed below, or by using the keyword search tool below to find specific information within the annual report.-
 1
1 -
2
-
3
-
4
-
5
-
6
-
7
-
8
-
9
-
10
-
11
-
12
-
13
-
 14
14 -
 15
15 -
 16
16 -
 17
17 -
 18
18 -
 19
19 -
 20
20 -
 21
21 -
 22
22 -
 23
23 -
 24
24 -
 25
25 -
 26
26 -
 27
27 -
 28
28 -
 29
29 -
 30
30 -
 31
31 -
 32
32 -
 33
33 -
 34
34 -
35
-
36
-
37
-
38
-
39
-
40
-
41
-
42
-
43
-
44
-
45
-
46
-
47
-
48
-
49
-
50
-
51
-
52
-
53
-
54
-
55
-
56
-
57
-
58
-
59
-
60
-
61
-
62
-
63
-
64
-
65
-
66
-
67
-
68
 |
 |

18
Results of Operations
For an understanding of the significant factors that influenced our performance during the past three fiscal years, the
following discussion should be read in conjunction with the Consolidated Financial Statements and the Notes to Consolidated
Financial Statements presented in this report.
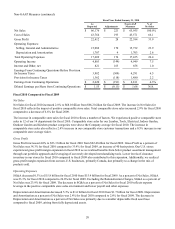
Fiscal 2011 Compared to Fiscal 2010
Net Sales
Net Sales for fiscal 2011 increased 3.5% to $70.4 billion from $68.0 billion for fiscal 2010. The increase in Net Sales for
fiscal 2011 reflects the impact of positive comparable store sales. Total comparable store sales increased 3.4% for fiscal 2011
compared to an increase of 2.9% for fiscal 2010.
The positive comparable store sales for fiscal 2011 reflect a number of factors including the execution of our key initiatives,
economic growth and favorable weather conditions. We experienced positive comparable store sales in 12 of our 14
departments for fiscal 2011. Comparable store sales for our Building Materials, Paint, Hardware, Tools, Plumbing, Electrical
and Kitchen product categories were above the Company average for fiscal 2011. Comparable store sales for our Flooring,
Bath, Lighting, Outdoor Garden and Indoor Garden product categories were positive for fiscal 2011. Comparable store sales
for our Lumber and Millwork product categories were negative for fiscal 2011. The increase in comparable store sales also
reflects a 2.6% increase in our comparable store average ticket and an 0.8% increase in our comparable store customer
transactions.
We believe that our sales performance has been, and could continue to be, negatively impacted by the level of competition
that we encounter in various markets. We estimate our share of the U.S. home improvement market is approximately 25%
using the U.S. Census Bureau’s North American Industry Classification System, or NAICS, 4441 classification for building
material and supplies dealers.
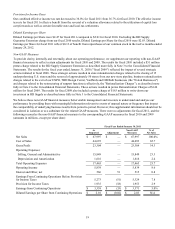
Gross Profit
Gross Profit increased 4.1% to $24.3 billion for fiscal 2011 from $23.3 billion for fiscal 2010. Gross Profit as a percent of Net
Sales was 34.5% for fiscal 2011 compared to 34.3% for fiscal 2010, an increase of 20 basis points. The increase in gross
profit margin in fiscal 2011 was driven primarily by benefits arising from our supply chain transformation in the U.S., which
was partially offset by higher shrink compared to last year.
Operating Expenses
Selling, General and Administrative expenses ("SG&A") increased 1.1% to $16.0 billion for fiscal 2011 from $15.8 billion
for fiscal 2010. As a percent of Net Sales, SG&A was 22.8% for fiscal 2011 compared to 23.3% for fiscal 2010. The decrease
in SG&A as a percent of Net Sales for fiscal 2011 reflects expense leverage in the positive comparable store sales
environment partially offset by a $32 million impairment charge for a non-core carpet cleaning and cabinet refinishing
business that was sold in fiscal 2011 and $26 million of expenses related to natural disasters. Additionally, we experienced an
expense benefit of $44 million in fiscal 2010 related to our private label credit card that did not repeat in fiscal 2011.
Depreciation and Amortization was $1.6 billion for both fiscal 2011 and 2010. Depreciation and Amortization as a percent of
Net Sales was 2.2% for fiscal 2011 compared to 2.4% for fiscal 2010. The decrease in Depreciation and Amortization as a
percent of Net Sales reflects expense leverage in the positive comparable store sales environment and an increase in fully
depreciated assets.
Operating Income
Operating Income increased 14.1% to $6.7 billion for fiscal 2011 from $5.8 billion for fiscal 2010. Operating Income as a
percent of Net Sales was 9.5% for fiscal 2011 compared to 8.6% for fiscal 2010.
Interest and Other, net
In fiscal 2011, we recognized $593 million of Interest and Other, net, compared to $566 million for fiscal 2010. Interest and
Other, net, as a percent of Net Sales was 0.8% for both fiscal 2011 and 2010. Interest and Other, net, for fiscal 2010 reflects a
$51 million pretax charge related to the extension of our guarantee of a senior secured loan of HD Supply, Inc. (the "HD
Supply Guarantee Extension"). Additionally, we experienced a $44 million benefit in fiscal 2010 that arose from favorable
Internal Revenue Service ("IRS") guidance and a resulting reversal of an interest accrual.