Home Depot 2008 Annual Report Download - page 63
Download and view the complete annual report
Please find page 63 of the 2008 Home Depot annual report below. You can navigate through the pages in the report by either clicking on the pages listed below, or by using the keyword search tool below to find specific information within the annual report.-
 1
1 -
2
-
3
-
4
-
5
-
6
-
7
-
8
-
9
-
10
-
11
-
12
-
13
-
14
-
15
-
16
-
17
-
18
-
19
-
20
-
21
-
22
-
23
-
24
-
25
-
26
-
27
-
28
-
29
-
30
-
31
-
32
-
33
-
34
-
35
-
36
-
37
-
38
-
39
-
40
-
41
-
42
-
43
-
44
-
45
-
46
-
47
-
48
-
49
-
50
-
51
-
52
-
 53
53 -
 54
54 -
 55
55 -
 56
56 -
 57
57 -
 58
58 -
 59
59 -
 60
60 -
 61
61 -
 62
62 -
 63
63 -
 64
64 -
 65
65 -
 66
66
 |
 |

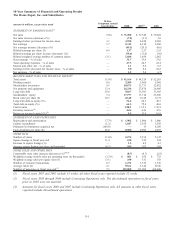
10-Year Summary of Financial and Operating Results
The Home Depot, Inc. and Subsidiaries
amounts in millions, except where noted
10-Year
Compound Annual
Growth Rate 2008 2007
(1)
2006
STATEMENT OF EARNINGS DATA
(2)
Net sales 9.0% $ 71,288 $ 77,349 $ 79,022
Net sales increase (decrease) (%) — (7.8) (2.1) 2.6
Earnings before provision for income taxes 3.1 3,590 6,620 8,502
Net earnings 3.7 2,312 4,210 5,266
Net earnings increase (decrease) (%) — (45.1) (20.1) (6.6)
Diluted earnings per share ($) 6.9 1.37 2.27 2.55
Diluted earnings per share increase (decrease) (%) — (39.6) (11.0) (3.0)
Diluted weighted average number of common shares (3.1) 1,686 1,856 2,062
Gross margin – % of sales — 33.7 33.6 33.6
Total operating expenses – % of sales — 27.5 24.3 22.4
Interest and other, net – % of sales — 1.1 0.8 0.5
Earnings before provision for income taxes – % of sales — 5.0 8.6 10.8
Net earnings – % of sales — 3.2 5.4 6.7
BALANCE SHEET DATA AND FINANCIAL RATIOS
(3)
Total assets 11.8% $ 41,164 $ 44,324 $ 52,263
Working capital 0.6 2,209 1,968 5,069
Merchandise inventories 9.5 10,673 11,731 12,822
Net property and equipment 12.4 26,234 27,476 26,605
Long-term debt 20.0 9,667 11,383 11,643
Stockholders’ equity 7.4 17,777 17,714 25,030
Book value per share ($) 10.3 10.48 10.48 12.71
Long-term debt-to-equity (%) — 54.4 64.3 46.5
Total debt-to-equity (%) — 64.3 75.8 46.6
Current ratio — 1.20:1 1.15:1 1.39:1
Inventory turnover
(2)
—4.0x 4.2x 4.5x
Return on invested capital (%)
(2)
—9.5 13.9 16.8
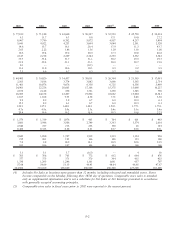
STATEMENT OF CASH FLOWS DATA
Depreciation and amortization 17.7% $ 1,902 $ 1,906 $ 1,886
Capital expenditures (1.2) 1,847 3,558 3,542
Payments for businesses acquired, net (100.0) —13 4,268
Cash dividends per share ($) 28.0 0.900 0.900 0.675
STORE DATA
Number of stores 11.6% 2,274 2,234 2,147
Square footage at fiscal year-end 11.4 238 235 224
Increase in square footage (%) — 1.3 4.9 4.2
Average square footage per store (in thousands) (0.2) 105 105 105
STORE SALES AND OTHER DATA
Comparable store sales increase (decrease) (%)
(4)(5)
—(8.7) (6.7) (2.8)
Weighted average weekly sales per operating store (in thousands) (3.3)% $ 601 $ 658 $ 723
Weighted average sales per square foot ($) (3.1) 298 332 358
Number of customer transactions 6.7 1,272 1,336 1,330
Average ticket ($) 2.1 55.61 57.48 58.90
Number of associates at fiscal year-end
(3)
7.5 322,000 331,000 364,400
(1) Fiscal years 2007 and 2001 include 53 weeks; all other fiscal years reported include 52 weeks.
(2) Fiscal years 2003 through 2008 include Continuing Operations only. The discontinued operations in fiscal years
prior to 2003 were not material.
(3) Amounts for fiscal years 2008 and 2007 include Continuing Operations only. All amounts in other fiscal years
reported include discontinued operations.
F-1