Home Depot 2008 Annual Report Download - page 20
Download and view the complete annual report
Please find page 20 of the 2008 Home Depot annual report below. You can navigate through the pages in the report by either clicking on the pages listed below, or by using the keyword search tool below to find specific information within the annual report.-
 1
1 -
2
-
3
-
4
-
5
-
6
-
7
-
8
-
9
-
 10
10 -
 11
11 -
 12
12 -
 13
13 -
 14
14 -
 15
15 -
 16
16 -
 17
17 -
 18
18 -
 19
19 -
 20
20 -
 21
21 -
 22
22 -
 23
23 -
 24
24 -
 25
25 -
 26
26 -
 27
27 -
 28
28 -
 29
29 -
 30
30 -
31
-
32
-
33
-
34
-
35
-
36
-
37
-
38
-
39
-
40
-
41
-
42
-
43
-
44
-
45
-
46
-
47
-
48
-
49
-
50
-
51
-
52
-
53
-
54
-
55
-
56
-
57
-
58
-
59
-
60
-
61
-
62
-
63
-
64
-
65
-
66
 |
 |

Item 7. Management’s Discussion and Analysis of Financial Condition and Results of Operations.
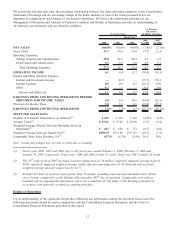
Executive Summary and Selected Consolidated Statements of Earnings Data
For fiscal year ended February 1, 2009 (“fiscal 2008”), we reported Net Earnings of $2.3 billion and Diluted Earnings per
Share of $1.34 compared to Net Earnings of $4.4 billion and Diluted Earnings per Share of $2.37 for fiscal year ended
February 3, 2008 (“fiscal 2007”).
We took action on several strategic items in fiscal 2008 resulting in total pretax charges of $951 million (“Rationalization
Charges”). These Rationalization Charges included the closing of 15 underperforming stores and the removal of
approximately 50 stores from our new store opening pipeline, the planned exit of our EXPO, THD Design Center,
Yardbirds and HD Bath businesses and strategic support staff reductions. Additionally, fiscal 2008 included a $163 million
pretax write-down of our investment in HD Supply and a $52 million loss from discontinued operations, net of tax, for the
settlement of working capital from the sale of HD Supply.
Fiscal 2008 consisted of 52 weeks compared with 53 weeks for fiscal 2007. The 53
rd
week added approximately
$1.1 billion in Net Sales and increased Diluted Earnings per Share from Continuing Operations by approximately $0.04
for fiscal 2007.
We reported Earnings from Continuing Operations of $2.3 billion and Diluted Earnings per Share from Continuing
Operations of $1.37 for fiscal 2008 compared to Earnings from Continuing Operations of $4.2 billion and Diluted
Earnings per Share from Continuing Operations of $2.27 for fiscal 2007. Excluding the Rationalization Charges and the
write-down of our investment in HD Supply, Earnings from Continuing Operations were $3.0 billion and Diluted Earnings
per Share from Continuing Operations were $1.78 for fiscal 2008.
Net Sales decreased 7.8% to $71.3 billion for fiscal 2008 from $77.3 billion for fiscal 2007. Excluding the 53
rd
week of
fiscal 2007, Net Sales decreased 6.5% for fiscal 2008. The slowdown in the global economy and weakness in the
U.S. residential construction and home improvement markets negatively impacted our Net Sales for fiscal 2008. Our
comparable store sales declined 8.7% in fiscal 2008 driven by a 5.5% decline in comparable store customer transactions,
as well as a 3.3% decline in our average ticket.
In fiscal 2008, despite the continuing difficult economic environment, we continued to focus on our core retail business,
investing in our associates and stores and improving our customer service. We have exited non-core businesses,
restructured support staff and have stopped applying significant capital to building new square footage. We remain
committed to the long-term health of our business through our strategy of investing in our retail business through the
following five priorities:
Associate Engagement – We have taken a number of actions to improve associate engagement by changing the way our
associates are compensated, recognized and rewarded, including enhancing our success sharing program, an incentive
program for our hourly associates driven by individual store performance. Success sharing payouts will be received by
83% of our stores for the second half of fiscal 2008 compared to 44% of stores for the same period last year.
Product Excitement – We continue to work on our merchandising transformation by redefining how we run our business,
implementing a focused bay portfolio approach to product assortment and creating new tools to support better
merchandising decision making. As a result, we saw consumer unit share gains against the market in several key
merchandising classes. For example, carpet, hand tools, power tools, blinds, bath fixtures, windows and doors all gained
share in fiscal 2008. Our new lower price campaign is a major component of our portfolio strategy. An example is interior
paint, where we have lowered prices on items such as Behr Flat Premium Plus. Unit sales are increasing, and at the same
time, our attachment sales of related items are going up.
Shopping Environment – We continued our store reinvestment by completing an aggressive list of maintenance projects,
including the completion of our lighting upgrade, as well as more complex repair and maintenance activities for hundreds
of other stores. In addition to programmatic maintenance, our integrated field and support center teams have rolled out
store standards to all stores. We developed and piloted common guidelines on store appearance and shopability, including
standards for front apron merchandising, wingstack usage, signage presentation, fixturing and off-shelf product. This
15