Home Depot 2008 Annual Report Download - page 22
Download and view the complete annual report
Please find page 22 of the 2008 Home Depot annual report below. You can navigate through the pages in the report by either clicking on the pages listed below, or by using the keyword search tool below to find specific information within the annual report.-
 1
1 -
2
-
3
-
4
-
5
-
6
-
7
-
8
-
9
-
10
-
11
-
 12
12 -
 13
13 -
 14
14 -
 15
15 -
 16
16 -
 17
17 -
 18
18 -
 19
19 -
 20
20 -
 21
21 -
 22
22 -
 23
23 -
 24
24 -
 25
25 -
 26
26 -
 27
27 -
 28
28 -
 29
29 -
 30
30 -
 31
31 -
 32
32 -
33
-
34
-
35
-
36
-
37
-
38
-
39
-
40
-
41
-
42
-
43
-
44
-
45
-
46
-
47
-
48
-
49
-
50
-
51
-
52
-
53
-
54
-
55
-
56
-
57
-
58
-
59
-
60
-
61
-
62
-
63
-
64
-
65
-
66
 |
 |

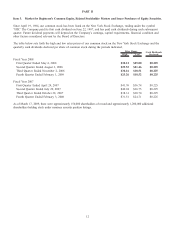
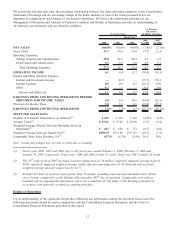
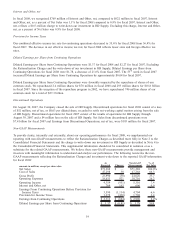
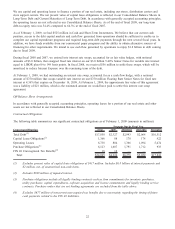
We believe the selected sales data, the percentage relationship between Net Sales and major categories in the Consolidated
Statements of Earnings and the percentage change in the dollar amounts of each of the items presented below are
important in evaluating the performance of our business operations. We believe the information presented in our
Management’s Discussion and Analysis of Financial Condition and Results of Operations provides an understanding of
our business, our operations and our financial condition.
2008 2007 2006 2008
vs. 2007 2007
vs. 2006
Fiscal Year
(1)
% of Net Sales
% Increase
(Decrease)
In Dollar Amounts
NET SALES 100.0% 100.0% 100.0% (7.8)% (2.1)%
Gross Profit 33.7 33.6 33.6 (7.7) (2.1)
Operating Expenses:
Selling, General and Administrative 25.0 22.1 20.4 4.7 5.9
Depreciation and Amortization 2.5 2.2 2.0 4.9 8.1
Total Operating Expenses 27.5 24.3 22.4 4.7 6.1
OPERATING INCOME 6.1 9.4 11.2 (39.8) (18.3)
Interest and Other (Income) Expense:
Interest and Investment Income —(0.1) — (75.7) 174.1
Interest Expense 0.9 0.9 0.5 (10.3) 78.0
Other 0.2 — — 0.0 0.0
Interest and Other, net 1.1 0.8 0.5 23.6 70.9
EARNINGS FROM CONTINUING OPERATIONS BEFORE
PROVISION FOR INCOME TAXES 5.0 8.6 10.8 (45.8) (22.1)
Provision for Income Taxes 1.8 3.1 4.1 (47.0) (25.5)
EARNINGS FROM CONTINUING OPERATIONS 3.2% 5.4% 6.7% (45.1)% (20.1)%
SELECTED SALES DATA
Number of Customer Transactions (in millions)
(2)
1,272 1,336 1,330 (4.8)% 0.5%
Average Ticket
(2)
$ 55.61 $ 57.48 $ 58.90 (3.3) (2.4)
Weighted Average Weekly Sales per Operating Store (in
thousands)
(2)
$ 601 $ 658 $ 723 (8.7) (9.0)
Weighted Average Sales per Square Foot
(2)
$298.19 $331.86 $357.83 (10.1) (7.3)
Comparable Store Sales Decrease (%)
(3)
(8.7)% (6.7)% (2.8)% N/A N/A
Note: Certain percentages may not sum to totals due to rounding.
(1) Fiscal years 2008, 2007 and 2006 refer to the fiscal years ended February 1, 2009, February 3, 2008 and
January 28, 2007, respectively. Fiscal years 2008 and 2006 include 52 weeks; fiscal year 2007 includes 53 weeks.
(2) The 53
rd
week of fiscal 2007 increased customer transactions by 20 million, negatively impacted average ticket by
$0.05, negatively impacted weighted average weekly sales per operating store by $3 thousand and increased
weighted average sales per square foot by $4.77.
(3) Includes Net Sales at locations open greater than 12 months, including relocated and remodeled stores. Retail
stores become comparable on the Monday following their 365
th
day of operation. Comparable store sales is
intended only as supplemental information and is not a substitute for Net Sales or Net Earnings presented in
accordance with generally accepted accounting principles.
Results of Operations
For an understanding of the significant factors that influenced our performance during the past three fiscal years, the
following discussion should be read in conjunction with the Consolidated Financial Statements and the Notes to
Consolidated Financial Statements presented in this report.
17