Home Depot 2008 Annual Report Download - page 23
Download and view the complete annual report
Please find page 23 of the 2008 Home Depot annual report below. You can navigate through the pages in the report by either clicking on the pages listed below, or by using the keyword search tool below to find specific information within the annual report.-
 1
1 -
2
-
3
-
4
-
5
-
6
-
7
-
8
-
9
-
10
-
11
-
12
-
 13
13 -
 14
14 -
 15
15 -
 16
16 -
 17
17 -
 18
18 -
 19
19 -
 20
20 -
 21
21 -
 22
22 -
 23
23 -
 24
24 -
 25
25 -
 26
26 -
 27
27 -
 28
28 -
 29
29 -
 30
30 -
 31
31 -
 32
32 -
 33
33 -
34
-
35
-
36
-
37
-
38
-
39
-
40
-
41
-
42
-
43
-
44
-
45
-
46
-
47
-
48
-
49
-
50
-
51
-
52
-
53
-
54
-
55
-
56
-
57
-
58
-
59
-
60
-
61
-
62
-
63
-
64
-
65
-
66
 |
 |
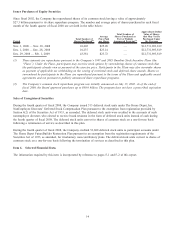
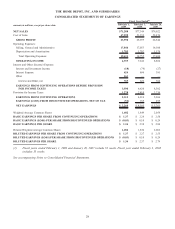
Fiscal 2008 Compared to Fiscal 2007
Net Sales
Fiscal 2008 consisted of 52 weeks compared to 53 weeks in fiscal 2007. Net Sales for fiscal 2008 decreased 7.8% to
$71.3 billion from $77.3 billion for fiscal 2007. The decrease in Net Sales for fiscal 2008 reflects the impact of negative
comparable store sales and $1.1 billion of Net Sales attributable to the additional week in fiscal 2007, partially offset by
Net Sales of $1.8 billion from new stores in fiscal 2008. Comparable store sales decreased 8.7% for fiscal 2008 compared
to a decrease of 6.7% for fiscal 2007.
There were a number of factors that contributed to our comparable store sales decline. The U.S. residential construction
and home improvement markets continued to be soft and consumers were challenged due to higher unemployment and an
across-the-board tightening of consumer credit availability. We saw relative strength in Building Materials, Plumbing,
Garden/Seasonal and Hardware as comparable store sales in these areas were above or at the Company average for fiscal
2008. Comparable store sales for Lumber, Flooring, Paint, Electrical, Kitchen/Bath and Millwork were below the
Company average for fiscal 2008. Softness in our big ticket categories negatively impacted average ticket, which
decreased 3.3% to $55.61 for fiscal 2008.
In order to meet our customer service objectives, we strategically open stores near market areas served by existing stores
(“cannibalize”) to enhance service levels, gain incremental sales and increase market penetration. Our new stores
cannibalized approximately 5% of our existing stores as of the end of fiscal 2008, which had a negative impact to
comparable store sales of approximately 1%.
We believe that our sales performance has been, and could continue to be, negatively impacted by the level of competition
that we encounter in various markets. Due to the highly-fragmented U.S. home improvement industry, in which we
estimate our market share is approximately 20%, measuring the impact on our sales by our competitors is difficult.
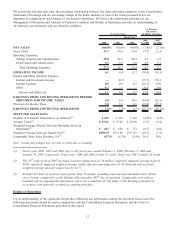
Gross Profit
Gross Profit decreased 7.7% to $24.0 billion for fiscal 2008 from $26.0 billion for fiscal 2007. Gross Profit as a percent
of Net Sales was 33.7% for fiscal 2008 compared to 33.6% for fiscal 2007, an increase of four basis points. This gross
margin expansion included $30 million in markdowns taken in connection with our Rationalization Charges. Excluding
these markdowns, our Gross Profit as a percent of Net Sales increased eight basis points for fiscal 2008, reflecting our
focused bay portfolio approach to product assortment.
Operating Expenses
Selling, General and Administrative expenses (“SG&A”) increased 4.7% to $17.8 billion for fiscal 2008 from
$17.1 billion for fiscal 2007. As a percent of Net Sales, SG&A was 25.0% for fiscal 2008 compared to 22.1% for fiscal
2007. Excluding the Rationalization Charges, SG&A as a percent of Net Sales for fiscal 2008 was 23.7%, an increase of
approximately 170 basis points over the prior year. The increase in SG&A as a percent of Net Sales for fiscal 2008 was
primarily the result of expense deleverage in the negative comparable store sales environment, as well as an increase of
approximately 70 basis points due to a higher cost of credit associated with the private label credit card program. For
fiscal 2008, the penetration of the private label credit card sales was 28.1% compared to 29.4% for fiscal 2007.
Depreciation and Amortization increased 4.9% to $1.8 billion for fiscal 2008 from $1.7 billion for fiscal 2007.
Depreciation and Amortization as a percent of Net Sales was 2.5% for fiscal 2008 and 2.2% for fiscal 2007. The increase
as a percent of Net Sales was primarily due to sales deleverage and the depreciation of our investments in shorter lived
assets such as store resets and technology.
Operating Income
Operating Income decreased 39.8% to $4.4 billion for fiscal 2008 from $7.2 billion for fiscal 2007. Operating Income as a
percent of Net Sales was 6.1% for fiscal 2008 compared to 9.4% for fiscal 2007. Excluding the Rationalization Charges,
Operating Income as a percent of Net Sales was 7.4% for fiscal 2008.
18