Home Depot 2008 Annual Report Download - page 33
Download and view the complete annual report
Please find page 33 of the 2008 Home Depot annual report below. You can navigate through the pages in the report by either clicking on the pages listed below, or by using the keyword search tool below to find specific information within the annual report.-
 1
1 -
2
-
3
-
4
-
5
-
6
-
7
-
8
-
9
-
10
-
11
-
12
-
13
-
14
-
15
-
16
-
17
-
18
-
19
-
20
-
21
-
22
-
 23
23 -
 24
24 -
 25
25 -
 26
26 -
 27
27 -
 28
28 -
 29
29 -
 30
30 -
 31
31 -
 32
32 -
 33
33 -
 34
34 -
 35
35 -
 36
36 -
 37
37 -
 38
38 -
 39
39 -
 40
40 -
 41
41 -
 42
42 -
 43
43 -
44
-
45
-
46
-
47
-
48
-
49
-
50
-
51
-
52
-
53
-
54
-
55
-
56
-
57
-
58
-
59
-
60
-
61
-
62
-
63
-
64
-
65
-
66
 |
 |

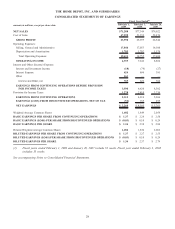
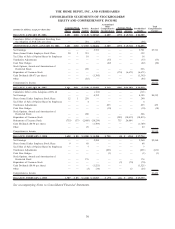
THE HOME DEPOT, INC. AND SUBSIDIARIES
CONSOLIDATED STATEMENTS OF EARNINGS
amounts in millions, except per share data February 1,
2009 February 3,
2008 January 28,
2007
Fiscal Year Ended
(1)
NET SALES $71,288 $77,349 $79,022
Cost of Sales 47,298 51,352 52,476
GROSS PROFIT 23,990 25,997 26,546
Operating Expenses:
Selling, General and Administrative 17,846 17,053 16,106
Depreciation and Amortization 1,785 1,702 1,574
Total Operating Expenses 19,631 18,755 17,680
OPERATING INCOME 4,359 7,242 8,866
Interest and Other (Income) Expense:
Interest and Investment Income (18) (74) (27)
Interest Expense 624 696 391
Other 163 ——
Interest and Other, net 769 622 364
EARNINGS FROM CONTINUING OPERATIONS BEFORE PROVISION
FOR INCOME TAXES 3,590 6,620 8,502
Provision for Income Taxes 1,278 2,410 3,236
EARNINGS FROM CONTINUING OPERATIONS 2,312 4,210 5,266
EARNINGS (LOSS) FROM DISCONTINUED OPERATIONS, NET OF TAX (52) 185 495
NET EARNINGS $ 2,260 $ 4,395 $ 5,761
Weighted Average Common Shares 1,682 1,849 2,054
BASIC EARNINGS PER SHARE FROM CONTINUING OPERATIONS $ 1.37 $ 2.28 $ 2.56
BASIC EARNINGS (LOSS) PER SHARE FROM DISCONTINUED OPERATIONS $ (0.03) $ 0.10 $ 0.24
BASIC EARNINGS PER SHARE $ 1.34 $ 2.38 $ 2.80
Diluted Weighted Average Common Shares 1,686 1,856 2,062
DILUTED EARNINGS PER SHARE FROM CONTINUING OPERATIONS $ 1.37 $ 2.27 $ 2.55
DILUTED EARNINGS (LOSS) PER SHARE FROM DISCONTINUED OPERATIONS $ (0.03) $ 0.10 $ 0.24
DILUTED EARNINGS PER SHARE $ 1.34 $ 2.37 $ 2.79
(1) Fiscal years ended February 1, 2009 and January 28, 2007 include 52 weeks. Fiscal year ended February 3, 2008
includes 53 weeks.
See accompanying Notes to Consolidated Financial Statements.
28