Home Depot 2008 Annual Report Download - page 45
Download and view the complete annual report
Please find page 45 of the 2008 Home Depot annual report below. You can navigate through the pages in the report by either clicking on the pages listed below, or by using the keyword search tool below to find specific information within the annual report.-
 1
1 -
2
-
3
-
4
-
5
-
6
-
7
-
8
-
9
-
10
-
11
-
12
-
13
-
14
-
15
-
16
-
17
-
18
-
19
-
20
-
21
-
22
-
23
-
24
-
25
-
26
-
27
-
28
-
29
-
30
-
31
-
32
-
33
-
34
-
 35
35 -
 36
36 -
 37
37 -
 38
38 -
 39
39 -
 40
40 -
 41
41 -
 42
42 -
 43
43 -
 44
44 -
 45
45 -
 46
46 -
 47
47 -
 48
48 -
 49
49 -
 50
50 -
 51
51 -
 52
52 -
 53
53 -
 54
54 -
 55
55 -
56
-
57
-
58
-
59
-
60
-
61
-
62
-
63
-
64
-
65
-
66
 |
 |

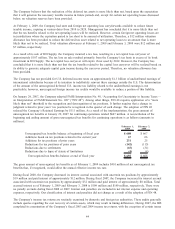
The Company does not believe that the effect of the stock option adjustment was material, either quantitatively or
qualitatively, in any of the years covered by the review of these items. In reaching that determination, the following
quantitative measures were considered (dollars in millions):
Fiscal Year
Net After-Tax
Effect of
Adjustment Reported Net
Earnings
Percent of
Reported Net
Earnings
2005 $ 11 $ 5,838 0.19%
2004 18 5,001 0.36
2003 18 4,304 0.42
2002 21 3,664 0.57
1981-2001 159 14,531 1.09
Total $227 $33,338 0.68%
Vendor Credits
The Company records credits against vendor invoices for various issues related to the receipt of goods. The Company
previously identified that it was not recording an allowance for subsequent reversals of these credits based on historical
experience. Beginning Retained Earnings for fiscal 2006 was decreased by $30 million in the accompanying Consolidated
Financial Statements to reflect the appropriate adjustments to Merchandise Inventories and Accounts Payable, net of tax.
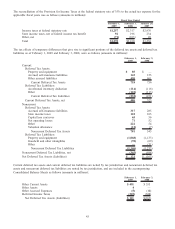
Impact of Adjustments
The impact of each of the items noted above, net of tax, on fiscal 2006 beginning balances are presented below (amounts
in millions):
Stock Option
Practices Vendor
Credits Total
Cumulative Effect as of January 30, 2006
Merchandise Inventories $ — $ 9 $ 9
Accounts Payable — (59) (59)
Deferred Income Taxes 11 20 31
Other Accrued Expenses (37) — (37)
Paid-In Capital (201) — (201)
Retained Earnings 227 30 257
Total $ — $ — $ —
40