Home Depot 2008 Annual Report Download - page 24
Download and view the complete annual report
Please find page 24 of the 2008 Home Depot annual report below. You can navigate through the pages in the report by either clicking on the pages listed below, or by using the keyword search tool below to find specific information within the annual report.-
 1
1 -
2
-
3
-
4
-
5
-
6
-
7
-
8
-
9
-
10
-
11
-
12
-
13
-
 14
14 -
 15
15 -
 16
16 -
 17
17 -
 18
18 -
 19
19 -
 20
20 -
 21
21 -
 22
22 -
 23
23 -
 24
24 -
 25
25 -
 26
26 -
 27
27 -
 28
28 -
 29
29 -
 30
30 -
 31
31 -
 32
32 -
 33
33 -
 34
34 -
35
-
36
-
37
-
38
-
39
-
40
-
41
-
42
-
43
-
44
-
45
-
46
-
47
-
48
-
49
-
50
-
51
-
52
-
53
-
54
-
55
-
56
-
57
-
58
-
59
-
60
-
61
-
62
-
63
-
64
-
65
-
66
 |
 |

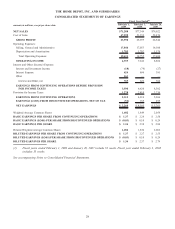
Interest and Other, net
In fiscal 2008, we recognized $769 million of Interest and Other, net, compared to $622 million in fiscal 2007. Interest
and Other, net, as a percent of Net Sales was 1.1% for fiscal 2008 compared to 0.8% for fiscal 2007. Interest and Other,
net, reflects a $163 million charge to write-down our investment in HD Supply. Excluding this charge, Interest and Other,
net, as a percent of Net Sales was 0.9% for fiscal 2008.
Provision for Income Taxes
Our combined effective income tax rate for continuing operations decreased to 35.6% for fiscal 2008 from 36.4% for
fiscal 2007. The decrease in our effective income tax rate for fiscal 2008 reflects lower state and foreign effective tax
rates.
Diluted Earnings per Share from Continuing Operations
Diluted Earnings per Share from Continuing Operations were $1.37 for fiscal 2008 and $2.27 for fiscal 2007. Excluding
the Rationalization Charges and the write-down of our investment in HD Supply, Diluted Earnings per Share from
Continuing Operations for fiscal 2008 were $1.78, a decrease of 21.6% from fiscal 2007. The 53
rd
week in fiscal 2007
increased Diluted Earnings per Share from Continuing Operations by approximately $0.04 for fiscal 2007.
Diluted Earnings per Share from Continuing Operations were favorably impacted by the repurchase of shares of our
common stock. We repurchased 2.4 million shares for $70 million in fiscal 2008 and 293 million shares for $10.8 billion
in fiscal 2007. Since the inception of the repurchase program in 2002, we have repurchased 746 million shares of our
common stock for a total of $27.3 billion.
Discontinued Operations
On August 30, 2007, the Company closed the sale of HD Supply. Discontinued operations for fiscal 2008 consist of a loss
of $52 million, net of tax, or $0.03 per diluted share, recorded to settle net working capital matters arising from the sale
of HD Supply. Discontinued operations for fiscal 2007 consist of the results of operations for HD Supply through
August 30, 2007 and a $4 million loss on the sale of HD Supply. Net Sales from discontinued operations were
$7.4 billion for fiscal 2007 and Earnings from Discontinued Operations, net of tax, were $185 million for fiscal 2007.
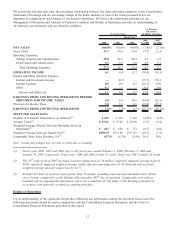
Non-GAAP Measurements
To provide clarity, internally and externally, about our operating performance for fiscal 2008, we supplemented our
reporting with non-GAAP measurements to reflect the Rationalization Charges as described more fully in Note 2 to the
Consolidated Financial Statements and the charge to write-down our investment in HD Supply as described in Note 4 to
the Consolidated Financial Statements. This supplemental information should not be considered in isolation or as a
substitute for the related GAAP measurements. We believe these non-GAAP measurements provide management and
investors with meaningful information to understand and analyze our performance. The following reconciles the non-
GAAP measurements reflecting the Rationalization Charges and investment write-down to the reported GAAP information
for fiscal 2008:
amounts in millions, except per share data
As
Reported Charges Non-GAAP
Measurement %of
Net Sales
Net Sales $71,288 $ — $71,288 100.0%
Cost of Sales 47,298 30 47,268 66.3
Gross Profit 23,990 (30) 24,020 33.7
Operating Expenses 19,631 921 18,710 26.2
Operating Income 4,359 (951) 5,310 7.4
Interest and Other, net 769 163 606 0.9
Earnings From Continuing Operations Before Provision for
Income Taxes 3,590 (1,114) 4,704 6.6
Provision for Income Taxes 1,278 (430) 1,708 2.4
Earnings from Continuing Operations $ 2,312 $ (684) $ 2,996 4.2%
Diluted Earnings per Share from Continuing Operations $ 1.37 $ (0.41) $ 1.78 N/A
19