Home Depot 2008 Annual Report Download - page 39
Download and view the complete annual report
Please find page 39 of the 2008 Home Depot annual report below. You can navigate through the pages in the report by either clicking on the pages listed below, or by using the keyword search tool below to find specific information within the annual report.-
 1
1 -
2
-
3
-
4
-
5
-
6
-
7
-
8
-
9
-
10
-
11
-
12
-
13
-
14
-
15
-
16
-
17
-
18
-
19
-
20
-
21
-
22
-
23
-
24
-
25
-
26
-
27
-
28
-
 29
29 -
 30
30 -
 31
31 -
 32
32 -
 33
33 -
 34
34 -
 35
35 -
 36
36 -
 37
37 -
 38
38 -
 39
39 -
 40
40 -
 41
41 -
 42
42 -
 43
43 -
 44
44 -
 45
45 -
 46
46 -
 47
47 -
 48
48 -
 49
49 -
50
-
51
-
52
-
53
-
54
-
55
-
56
-
57
-
58
-
59
-
60
-
61
-
62
-
63
-
64
-
65
-
66
 |
 |

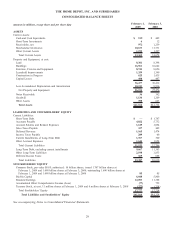
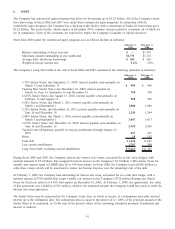
over the original term of the lease or the useful life of the improvement, whichever is shorter. The Company’s Property
and Equipment is depreciated using the following estimated useful lives:
Life
Buildings 5-45 years
Furniture, Fixtures and Equipment 3-20 years
Leasehold Improvements 5-45 years
Capitalized Software Costs
The Company capitalizes certain costs related to the acquisition and development of software and amortizes these costs
using the straight-line method over the estimated useful life of the software, which is three to six years. These costs are
included in Furniture, Fixtures and Equipment in the accompanying Consolidated Balance Sheets. Certain development
costs not meeting the criteria for capitalization are expensed as incurred.
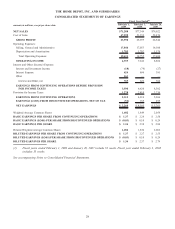
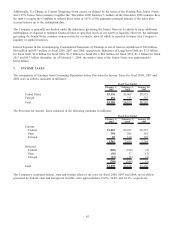
Revenues
The Company recognizes revenue, net of estimated returns and sales tax, at the time the customer takes possession of
merchandise or receives services. The liability for sales returns is estimated based on historical return levels. When the
Company receives payment from customers before the customer has taken possession of the merchandise or the service
has been performed, the amount received is recorded as Deferred Revenue in the accompanying Consolidated Balance
Sheets until the sale or service is complete. The Company also records Deferred Revenue for the sale of gift cards and
recognizes this revenue upon the redemption of gift cards in Net Sales. Gift card breakage income is recognized based
upon historical redemption patterns and represents the balance of gift cards for which the Company believes the likelihood
of redemption by the customer is remote. During fiscal 2008, 2007 and 2006, the Company recognized $37 million,
$36 million and $33 million, respectively, of gift card breakage income. This income is recorded as other income and is
included in the accompanying Consolidated Statements of Earnings as a reduction in SG&A.
Services Revenue
Net Sales include services revenue generated through a variety of installation, home maintenance and professional service
programs. In these programs, the customer selects and purchases material for a project and the Company provides or
arranges professional installation. These programs are offered through the Company’s stores. Under certain programs,
when the Company provides or arranges the installation of a project and the subcontractor provides material as part of the
installation, both the material and labor are included in services revenue. The Company recognizes this revenue when the
service for the customer is complete.
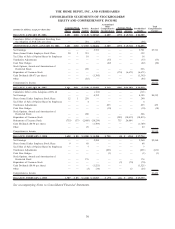
All payments received prior to the completion of services are recorded in Deferred Revenue in the accompanying
Consolidated Balance Sheets. Services revenue was $3.1 billion, $3.5 billion and $3.8 billion for fiscal 2008, 2007 and
2006, respectively.
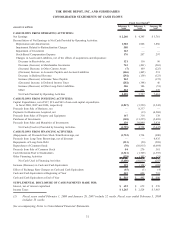
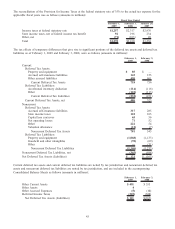
Self-Insurance
The Company is self-insured for certain losses related to general liability, product liability, automobile, workers’
compensation and medical claims. The expected ultimate cost for claims incurred as of the balance sheet date is not
discounted and is recognized as a liability. The expected ultimate cost of claims is estimated based upon analysis of
historical data and actuarial estimates.
Prepaid Advertising
Television and radio advertising production costs, along with media placement costs, are expensed when the advertisement
first appears. Included in Other Current Assets in the accompanying Consolidated Balance Sheets are $18 million and
$31 million, respectively, at the end of fiscal 2008 and 2007 relating to prepayments of production costs for print and
broadcast advertising as well as sponsorship promotions.
34