Home Depot 2008 Annual Report Download - page 25
Download and view the complete annual report
Please find page 25 of the 2008 Home Depot annual report below. You can navigate through the pages in the report by either clicking on the pages listed below, or by using the keyword search tool below to find specific information within the annual report.-
 1
1 -
2
-
3
-
4
-
5
-
6
-
7
-
8
-
9
-
10
-
11
-
12
-
13
-
14
-
 15
15 -
 16
16 -
 17
17 -
 18
18 -
 19
19 -
 20
20 -
 21
21 -
 22
22 -
 23
23 -
 24
24 -
 25
25 -
 26
26 -
 27
27 -
 28
28 -
 29
29 -
 30
30 -
 31
31 -
 32
32 -
 33
33 -
 34
34 -
 35
35 -
36
-
37
-
38
-
39
-
40
-
41
-
42
-
43
-
44
-
45
-
46
-
47
-
48
-
49
-
50
-
51
-
52
-
53
-
54
-
55
-
56
-
57
-
58
-
59
-
60
-
61
-
62
-
63
-
64
-
65
-
66
 |
 |
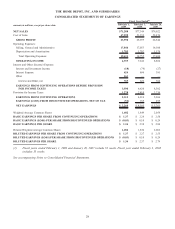
Fiscal 2007 Compared to Fiscal Year Ended January 28, 2007 (“fiscal 2006”)
Net Sales
Fiscal 2007 consisted of 53 weeks compared to 52 weeks in fiscal 2006. Net Sales for fiscal 2007 decreased 2.1%, or
$1.7 billion, to $77.3 billion from $79.0 billion for fiscal 2006. The decrease in Net Sales for fiscal 2007 reflects the
impact of negative comparable store sales, partially offset by Net Sales of $3.7 billion for fiscal 2007 from new stores and
$1.1 billion of Net Sales attributable to the additional week in fiscal 2007. Comparable store sales decreased 6.7% for
fiscal 2007 compared to a decrease of 2.8% for fiscal 2006.
There were a number of factors that contributed to our comparable store sales decline. The residential construction and
home improvement markets continued to be soft, especially in some of our traditionally strong markets such as Florida,
California and the Northeast. The combination of softness in our big ticket categories and commodity price deflation
negatively impacted average ticket, which decreased 2.4% to $57.48 for fiscal 2007. Our international business performed
well in fiscal 2007. Our Mexican stores posted a double digit comparable store sales increase for fiscal 2007, and
Canada’s comparable store sales were also positive. Our new stores cannibalized approximately 10% of our existing stores
as of the end of fiscal 2007, which had a negative impact to comparable store sales of approximately 1%.
Gross Profit
Gross Profit decreased 2.1% to $26.0 billion for fiscal 2007 from $26.5 billion for fiscal 2006. Gross Profit as a percent
of Net Sales was 33.6% for fiscal 2007, flat compared to fiscal 2006. Lower deferred interest costs associated with our
private label credit card financing programs provided a benefit of 39 basis points to Gross Profit as a percent of Net Sales
for fiscal 2007. The deferred interest benefit was mostly offset by a higher penetration of lower margin products such as
appliances and markdowns taken to clear through some seasonal items, such as outdoor power equipment and grills, and
to allow us to transition into new products, such as assembled cabinets and kitchen accessories.
Operating Expenses
SG&A increased 5.9% to $17.1 billion for fiscal 2007 from $16.1 billion for fiscal 2006. As a percent of Net Sales,
SG&A was 22.1% for fiscal 2007 compared to 20.4% for fiscal 2006. In fiscal 2007, our profit sharing with the third-
party administrator of the private label credit card portfolio was $275 million less than what we received in fiscal 2006.
We also recognized $88 million of write-offs associated with certain future store locations that we determined we will not
open and $34 million of expense associated with closing our 11 Home Depot Landscape Supply stores and our Tampa
Call Center in fiscal 2007. SG&A also reflects investments we are making in support of our five key priorities. As a
percentage of Net Sales, total payroll increased by 76 basis points for fiscal 2007 over fiscal 2006. This reflects
investments in store labor and our Master Trade Specialists program, the impact of our success sharing bonus plans, as
well as the negative sales environment. The increase in SG&A for fiscal 2007 over fiscal 2006 was partially offset by
$129 million of executive severance recorded in fiscal 2006.
Depreciation and Amortization increased 8.1% to $1.7 billion for fiscal 2007 from $1.6 billion for fiscal 2006.
Depreciation and Amortization as a percent of Net Sales was 2.2% for fiscal 2007 and 2.0% for fiscal 2006. The increase
as a percent of Net Sales was primarily due to the depreciation of our investments in store modernization and technology.
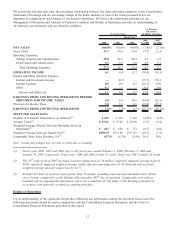
Operating Income
Operating Income decreased 18.3% to $7.2 billion for fiscal 2007 from $8.9 billion for fiscal 2006. Operating Income as a
percent of Net Sales was 9.4% for fiscal 2007 compared to 11.2% for fiscal 2006.
Interest and Other, net
In fiscal 2007, we recognized $622 million of net Interest Expense compared to $364 million in fiscal 2006. Net Interest
Expense as a percent of Net Sales was 0.8% for fiscal 2007 compared to 0.5% for fiscal 2006. The increase was primarily
due to additional interest incurred related to the December 2006 issuance of $750 million of Floating Rate Senior Notes,
$1.25 billion of 5.25% Senior Notes and $3.0 billion of 5.875% Senior Notes.
20