Hasbro 2011 Annual Report Download - page 94
Download and view the complete annual report
Please find page 94 of the 2011 Hasbro annual report below. You can navigate through the pages in the report by either clicking on the pages listed below, or by using the keyword search tool below to find specific information within the annual report.-
 1
1 -
2
-
3
-
4
-
5
-
6
-
7
-
8
-
9
-
10
-
11
-
12
-
13
-
14
-
15
-
16
-
17
-
18
-
19
-
20
-
21
-
22
-
23
-
24
-
25
-
26
-
27
-
28
-
29
-
30
-
31
-
32
-
33
-
34
-
35
-
36
-
37
-
38
-
39
-
40
-
41
-
42
-
43
-
44
-
45
-
46
-
47
-
48
-
49
-
50
-
51
-
52
-
53
-
54
-
55
-
56
-
57
-
58
-
59
-
60
-
61
-
62
-
63
-
64
-
65
-
66
-
67
-
68
-
69
-
70
-
71
-
72
-
73
-
74
-
75
-
76
-
77
-
78
-
79
-
80
-
81
-
82
-
83
-
 84
84 -
 85
85 -
 86
86 -
 87
87 -
 88
88 -
 89
89 -
 90
90 -
 91
91 -
 92
92 -
 93
93 -
 94
94 -
 95
95 -
 96
96 -
 97
97 -
 98
98 -
 99
99 -
 100
100 -
 101
101 -
 102
102 -
 103
103 -
 104
104 -
105
-
106
-
107
-
108
-
109
-
110
 |
 |

HASBRO, INC. AND SUBSIDIARIES
Notes to Consolidated Financial Statements — (Continued)
(Thousands of Dollars and Shares Except Per Share Data)
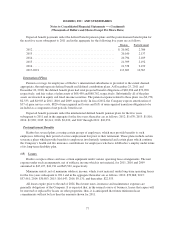
(19) Quarterly Financial Data (Unaudited)
Quarter
First Second Third Fourth Full Year
2011
Net revenues ................... $671,986 908,454 1,375,811 1,329,338 4,285,589
Operating profit ................. 48,923 80,407 248,072 216,579 593,981
Earnings before income taxes ...... 22,838 52,954 221,457 189,144 486,393
Net earnings .................... 17,196 58,051 170,990 139,130 385,367
Per common share
Net earnings
Basic ..................... $ 0.12 0.43 1.29 1.08 2.88
Diluted .................... 0.12 0.42 1.27 1.06 2.82
Market price
High ...................... $ 48.70 48.43 46.01 39.20 48.70
Low ...................... 42.54 42.63 33.21 31.36 31.36
Cash dividends declared ........ $ 0.30 0.30 0.30 0.30 1.20
Quarter
First Second Third Fourth Full Year
2010
Net revenues ................... $672,371 737,791 1,313,302 1,278,697 4,002,161
Operating profit ................. 69,327 79,726 237,757 201,049 587,859
Earnings before income taxes ...... 54,230 61,037 219,073 173,380 507,720
Net earnings .................... 58,943 43,631 155,164 140,014 397,752
Per common share
Net earnings
Basic ..................... $ 0.43 0.30 1.12 1.02 2.86
Diluted .................... 0.40 0.29 1.09 0.99 2.74
Market price
High ...................... $ 38.82 43.71 45.55 50.17 50.17
Low ...................... 30.20 36.50 37.65 44.22 30.20
Cash dividends declared ........ $ 0.25 0.25 0.25 0.25 1.00
85