Hasbro 2011 Annual Report Download - page 92
Download and view the complete annual report
Please find page 92 of the 2011 Hasbro annual report below. You can navigate through the pages in the report by either clicking on the pages listed below, or by using the keyword search tool below to find specific information within the annual report.-
 1
1 -
2
-
3
-
4
-
5
-
6
-
7
-
8
-
9
-
10
-
11
-
12
-
13
-
14
-
15
-
16
-
17
-
18
-
19
-
20
-
21
-
22
-
23
-
24
-
25
-
26
-
27
-
28
-
29
-
30
-
31
-
32
-
33
-
34
-
35
-
36
-
37
-
38
-
39
-
40
-
41
-
42
-
43
-
44
-
45
-
46
-
47
-
48
-
49
-
50
-
51
-
52
-
53
-
54
-
55
-
56
-
57
-
58
-
59
-
60
-
61
-
62
-
63
-
64
-
65
-
66
-
67
-
68
-
69
-
70
-
71
-
72
-
73
-
74
-
75
-
76
-
77
-
78
-
79
-
80
-
81
-
 82
82 -
 83
83 -
 84
84 -
 85
85 -
 86
86 -
 87
87 -
 88
88 -
 89
89 -
 90
90 -
 91
91 -
 92
92 -
 93
93 -
 94
94 -
 95
95 -
 96
96 -
 97
97 -
 98
98 -
 99
99 -
 100
100 -
 101
101 -
 102
102 -
103
-
104
-
105
-
106
-
107
-
108
-
109
-
110
 |
 |

HASBRO, INC. AND SUBSIDIARIES
Notes to Consolidated Financial Statements — (Continued)
(Thousands of Dollars and Shares Except Per Share Data)
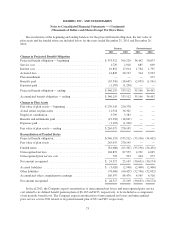
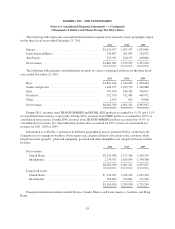
The following table represents consolidated International segment net revenues by major geographic region
for the three fiscal years ended December 25, 2011.
2011 2010 2009
Europe ........................................... $1,254,427 1,057,937 1,032,096
Latin America/Mexico .............................. 334,887 281,835 226,532
Asia Pacific ....................................... 272,587 220,155 200,848
Net revenues ...................................... $1,861,901 1,559,927 1,459,476
The following table presents consolidated net revenues by classes of principal products for the three fiscal
years ended December 25, 2011.
2011 2010 2009
Boys ............................................. $1,821,544 1,344,899 1,452,444
Games and puzzles ................................. 1,166,977 1,293,772 1,340,886
Girls ............................................. 741,394 830,383 790,817
Preschool ......................................... 552,979 532,483 469,932
Other ............................................ 2,695 624 13,868
Net revenues ...................................... $4,285,589 4,002,161 4,067,947
During 2011, revenues from TRANSFORMERS and BEYBLADE products accounted for 11.3% and 11.1%
of consolidated net revenues, respectively. During 2010, revenues from NERF products accounted for 10.3% of
consolidated net revenues. During 2009, revenues from TRANSFORMERS products accounted for 14.5% of
consolidated net revenues. No other individual product lines accounted for 10% or more of consolidated net
revenues in 2011, 2010 or 2009.
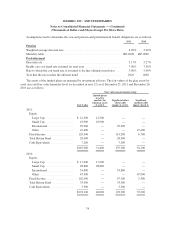
Information as to Hasbro’s operations in different geographical areas is presented below on the basis the
Company uses to manage its business. Net revenues are categorized based on location of the customer, while
long-lived assets (property, plant and equipment, goodwill and other intangibles) are categorized based on their
location:
2011 2010 2009
Net revenues
United States .................................... $2,155,038 2,173,266 2,363,559
International .................................... 2,130,551 1,828,895 1,704,388
$4,285,589 4,002,161 4,067,947
Long-lived assets
United States .................................... $ 974,037 1,014,149 1,059,304
International .................................... 186,069 194,841 191,900
$1,160,106 1,208,990 1,251,204
Principal international markets include Europe, Canada, Mexico and Latin America, Australia, and Hong
Kong.
83