Hasbro 2011 Annual Report Download - page 44
Download and view the complete annual report
Please find page 44 of the 2011 Hasbro annual report below. You can navigate through the pages in the report by either clicking on the pages listed below, or by using the keyword search tool below to find specific information within the annual report.-
 1
1 -
2
-
3
-
4
-
5
-
6
-
7
-
8
-
9
-
10
-
11
-
12
-
13
-
14
-
15
-
16
-
17
-
18
-
19
-
20
-
21
-
22
-
23
-
24
-
25
-
26
-
27
-
28
-
29
-
30
-
31
-
32
-
33
-
 34
34 -
 35
35 -
 36
36 -
 37
37 -
 38
38 -
 39
39 -
 40
40 -
 41
41 -
 42
42 -
 43
43 -
 44
44 -
 45
45 -
 46
46 -
 47
47 -
 48
48 -
 49
49 -
 50
50 -
 51
51 -
 52
52 -
 53
53 -
 54
54 -
55
-
56
-
57
-
58
-
59
-
60
-
61
-
62
-
63
-
64
-
65
-
66
-
67
-
68
-
69
-
70
-
71
-
72
-
73
-
74
-
75
-
76
-
77
-
78
-
79
-
80
-
81
-
82
-
83
-
84
-
85
-
86
-
87
-
88
-
89
-
90
-
91
-
92
-
93
-
94
-
95
-
96
-
97
-
98
-
99
-
100
-
101
-
102
-
103
-
104
-
105
-
106
-
107
-
108
-
109
-
110
 |
 |

Liquidity and Capital Resources
The Company has historically generated a significant amount of cash from operations. In 2011, the
Company funded its operations and liquidity needs primarily through cash flows from operations, and, when
needed, using borrowings under its available lines of credit and its commercial paper program. During 2012, the
Company expects to continue to fund its working capital needs primarily through cash flows from operations
and, when needed, by issuing commercial paper or borrowing under its revolving credit agreement. In the event
that the Company is not able to issue commercial paper, the Company intends to utilize its available lines of
credit. The Company believes that the funds available to it, including cash expected to be generated from
operations and funds available through its commercial paper program or its available lines of credit are adequate
to meet its working capital needs for 2012, however, unexpected events or circumstances such as material
operating losses or increased capital or other expenditures, or inability to otherwise access the commercial paper
market, may reduce or eliminate the availability of external financial resources. In addition, significant
disruptions to credit markets may also reduce or eliminate the availability of external financial resources.
Although the Company believes the risk of nonperformance by the counterparties to its financial facilities is not
significant, in times of severe economic downturn in the credit markets it is possible that one or more sources of
external financing may be unable or unwilling to provide funding to the Company.
As of December 25, 2011 the Company’s cash and cash equivalents totaled $641,688, substantially all of
which is held outside of the U.S. Deferred income taxes have not been provided on the majority of undistributed
earnings of international subsidiaries as the majority of such earnings are indefinitely reinvested by the
Company. Such international cash balances are not available to fund U.S. cash requirements unless the Company
decided to repatriate such funds. The Company has sufficient sources of cash in the U.S. to fund U.S. cash
requirements without the need to repatriate any funds. If the Company’s assessment of indefinite reinvestment of
international earnings changes, it would be required to accrue for any additional income taxes representing the
difference between the tax rates in the U.S. and the applicable tax jurisdiction of the international subsidiaries. If
the Company repatriated the funds from its’ international subsidiaries, it would then be required to pay the
additional U.S. income tax. The majority of the Company’s cash and cash equivalents held outside of the U.S. as
of December 25, 2011 is denominated in the U.S. dollar.
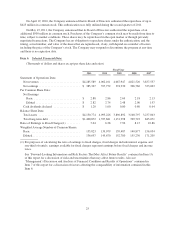
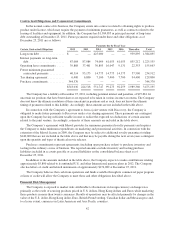
At December 25, 2011, cash and cash equivalents, net of short-term borrowings, were $461,258 compared
to $713,228 and $621,932 at December 26, 2010 and December 27, 2009, respectively. Hasbro generated
$396,069, $367,981 and $265,623 of cash from its operating activities in 2011, 2010 and 2009, respectively.
Operating cash flows in 2011, 2010 and 2009 included $80,983, $52,047 and $1,837, respectively, of cash used
for television program production. In 2012, the Company expects cash expenditures related to television program
production to be in the range of $70,000 to $80,000. Cash from operations in 2011, 2010 and 2009 also includes
long-term royalty advance payments of $25,000 made to THE HUB in each of the three years. Operating cash
flows in 2009 were also negatively impacted by the Company’s decision to sell $250,000 of its accounts
receivable under its securitization program at December 28, 2008. The securitization program was not utilized at
year end 2009 or in 2010, and was terminated in January 2011.
Accounts receivable, net increased to $1,034,580 at December 25, 2011 from $961,252 at December 26,
2010. The accounts receivable balance at December 25, 2011 includes a decrease of approximately $24,900 as a
result of the translation of foreign currency. Absent the effect of foreign exchange, the increase in accounts
receivable reflects increased sales and timing of such sales in the fourth quarter of 2011 compared to the fourth
quarter of 2010. Days sales outstanding increased to 70 days at December 25, 2011 from 68 days at
December 26, 2010. Accounts receivable decreased to $961,252 at December 26, 2010 from $1,038,802 at
December 27, 2009. The accounts receivable balance at December 26, 2010 includes a decrease of approximately
$11,500 as a result of the translation of foreign currency balances. Absent the effect of foreign exchange, the
decrease in accounts receivable reflects decreased sales in the fourth quarter of 2010 compared to the fourth
quarter of 2009.
Inventories decreased to $333,993 at December 25, 2011 compared to $364,194 at December 26, 2010. The
decreased inventory balance at December 25, 2011 reflects higher sales in the fourth quarter of 2011 compared to
2010 as well as the Company’s efforts to lower its overall levels from year-end 2010. Inventories increased to
35