Hasbro 2011 Annual Report Download - page 39
Download and view the complete annual report
Please find page 39 of the 2011 Hasbro annual report below. You can navigate through the pages in the report by either clicking on the pages listed below, or by using the keyword search tool below to find specific information within the annual report.-
 1
1 -
2
-
3
-
4
-
5
-
6
-
7
-
8
-
9
-
10
-
11
-
12
-
13
-
14
-
15
-
16
-
17
-
18
-
19
-
20
-
21
-
22
-
23
-
24
-
25
-
26
-
27
-
28
-
 29
29 -
 30
30 -
 31
31 -
 32
32 -
 33
33 -
 34
34 -
 35
35 -
 36
36 -
 37
37 -
 38
38 -
 39
39 -
 40
40 -
 41
41 -
 42
42 -
 43
43 -
 44
44 -
 45
45 -
 46
46 -
 47
47 -
 48
48 -
 49
49 -
50
-
51
-
52
-
53
-
54
-
55
-
56
-
57
-
58
-
59
-
60
-
61
-
62
-
63
-
64
-
65
-
66
-
67
-
68
-
69
-
70
-
71
-
72
-
73
-
74
-
75
-
76
-
77
-
78
-
79
-
80
-
81
-
82
-
83
-
84
-
85
-
86
-
87
-
88
-
89
-
90
-
91
-
92
-
93
-
94
-
95
-
96
-
97
-
98
-
99
-
100
-
101
-
102
-
103
-
104
-
105
-
106
-
107
-
108
-
109
-
110
 |
 |

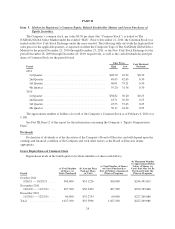
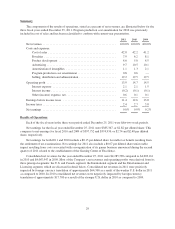
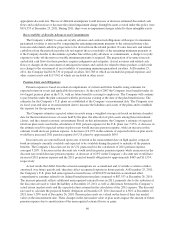
The following table presents net revenues and operating profit data for the Company’s three principal
segments for 2011, 2010 and 2009.
2011
%
Change 2010
%
Change 2009
Net Revenues
U.S. and Canada ............... $2,253,458 (2)% $2,299,547 (6)% $2,447,943
International .................. $1,861,901 19% $1,559,927 7% $1,459,476
Entertainment and Licensing ..... $ 162,233 19% $ 136,488 (12)% $ 155,013
Operating Profit
U.S. and Canada ............... $ 278,356 (20)% $ 349,594 (8)% $ 380,580
International .................. $ 270,578 29% $ 209,704 29% $ 162,159
Entertainment and Licensing ..... $ 42,784 (1)% $ 43,234 (34)% $ 65,572
U.S. and Canada
U.S. and Canada segment net revenues for the year ended December 25, 2011 decreased 2% to $2,253,458
from $2,299,547 in 2010. In 2011, net revenues were positively impacted by currency translation of
approximately $4,700. The decrease in net revenues in 2011 was due to decreased revenues in the girls’ toys and
games and puzzles categories. The decrease in the girls’ category was primarily the result of decreased sales of
LITTLEST PET SHOP and FURREAL FRIENDS partially offset by increased sales of BABY ALIVE and MY
LITTLE PONY. The decrease in the games and puzzles category was due to decreased sales of traditional board
games and puzzles partially offset by increased sales of MAGIC: THE GATHERING products. Decreases in the
girls’ toys and games and puzzles categories were partially offset by increased sales in the boys’ toys and
preschool categories. Increases in boys’ toys sales were significantly impacted by the first full year of sales of
BEYBLADE products after its reintroduction in the second half of 2010. Higher sales of TRANSFORMERS,
which benefited from the theatrical release of TRANSFORMERS: DARK OF THE MOON, as well as sales of
KRE-O products, which were introduced during the second half of 2011, also contributed to increased sales in
the boys’ toys category. These increases were partially offset by decreased sales of NERF products, and to a
lesser extent, STAR WARS and TONKA product lines. The preschool category benefited from the introduction
of several new products under the Company’s license with Sesame Workshop as well as increased sales of
TRANSFORMERS and STAR WARS products specifically designed for younger consumers. Increased net
revenues in the preschool category were partially offset by decreased sales of PLAYSKOOL, TONKA, and
PLAY-DOH products, which had stronger sales during 2010.
U.S. and Canada operating profit decreased to $278,356, or 12.4% of net revenues, in 2011 from $349,594,
or 15.2% of net revenues in 2010. Foreign currency translation did not have a material impact on U.S. and
Canada operating profit in 2011. Operating profit was negatively impacted by the decline in net revenues. In
addition, higher sales of licensed properties, such as BEYBLADE and movie-related TRANSFORMERS
products, resulted in higher royalty expense in 2011. The decline in operating margin was largely due to the
lower revenue base in 2011; product mix, including lower revenues from board games and higher revenues from
entertainment-based products; and the impact of closeout sales.
U.S. and Canada segment net revenues for the year ended December 26, 2010 decreased 6% to $2,299,547
from $2,447,943 in 2009. The decrease in net revenues in 2010 was primarily due to decreased revenues in the
boys’ toys category, primarily as a result of decreased sales of TRANSFORMERS and G.I. JOE products. The
2009 sales of these lines benefited from the theatrical releases of TRANSFORMERS: REVENGE OF THE
FALLEN in June 2009 and G.I. JOE: THE RISE OF COBRA in August 2009. Boys’ toys sales were also
negatively impacted by decreased sales of STAR WARS products. These decreases were partially offset by
increased sales of NERF products as well as increased sales of MARVEL products, which benefited from the
theatrical release of IRON MAN 2 in May 2010. Boys’ toys sales were also positively impacted by the
reintroduction of BEYBLADE products in the second half of 2010. Net revenues in the games and puzzles
30