Hasbro 2011 Annual Report Download - page 91
Download and view the complete annual report
Please find page 91 of the 2011 Hasbro annual report below. You can navigate through the pages in the report by either clicking on the pages listed below, or by using the keyword search tool below to find specific information within the annual report.-
 1
1 -
2
-
3
-
4
-
5
-
6
-
7
-
8
-
9
-
10
-
11
-
12
-
13
-
14
-
15
-
16
-
17
-
18
-
19
-
20
-
21
-
22
-
23
-
24
-
25
-
26
-
27
-
28
-
29
-
30
-
31
-
32
-
33
-
34
-
35
-
36
-
37
-
38
-
39
-
40
-
41
-
42
-
43
-
44
-
45
-
46
-
47
-
48
-
49
-
50
-
51
-
52
-
53
-
54
-
55
-
56
-
57
-
58
-
59
-
60
-
61
-
62
-
63
-
64
-
65
-
66
-
67
-
68
-
69
-
70
-
71
-
72
-
73
-
74
-
75
-
76
-
77
-
78
-
79
-
80
-
 81
81 -
 82
82 -
 83
83 -
 84
84 -
 85
85 -
 86
86 -
 87
87 -
 88
88 -
 89
89 -
 90
90 -
 91
91 -
 92
92 -
 93
93 -
 94
94 -
 95
95 -
 96
96 -
 97
97 -
 98
98 -
 99
99 -
 100
100 -
 101
101 -
102
-
103
-
104
-
105
-
106
-
107
-
108
-
109
-
110
 |
 |

HASBRO, INC. AND SUBSIDIARIES
Notes to Consolidated Financial Statements — (Continued)
(Thousands of Dollars and Shares Except Per Share Data)
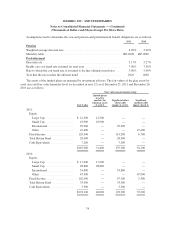
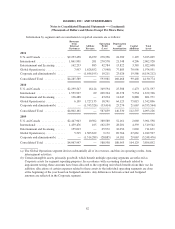
Information by segment and a reconciliation to reported amounts are as follows:
Revenues
from
External
Customers
Affiliate
Revenue
Operating
Profit
(Loss)
Depreciation
and
Amortization
Capital
Additions
Total
Assets
2011
U.S. and Canada ................ $2,253,458 16,259 278,356 24,389 1,199 5,225,099
International ................... 1,861,901 201 270,578 21,348 4,296 2,062,928
Entertainment and Licensing ...... 162,233 883 42,784 13,822 3,365 1,022,008
Global Operations(a) ............. 7,997 1,628,852 (7,948) 77,883 70,956 1,974,951
Corporate and eliminations(b) ..... — (1,646,195) 10,211 23,026 19,586 (6,154,212)
Consolidated Total .............. $4,285,589 — 593,981 160,468 99,402 4,130,774
2010
U.S. and Canada ................ $2,299,547 16,124 349,594 25,508 1,473 4,571,597
International ................... 1,559,927 69 209,704 20,378 5,554 1,672,326
Entertainment and Licensing ...... 136,488 — 43,234 11,047 8,888 861,971
Global Operations(a) ............. 6,199 1,727,133 18,741 64,123 75,015 1,542,896
Corporate and eliminations(b) ..... — (1,743,326) (33,414) 25,274 21,667 (4,555,564)
Consolidated Total .............. $4,002,161 — 587,859 146,330 112,597 4,093,226
2009
U.S. and Canada ................ $2,447,943 10,502 380,580 52,161 2,060 3,901,598
International ................... 1,459,476 165 162,159 28,201 4,339 1,519,542
Entertainment and Licensing ...... 155,013 — 65,572 16,656 1,002 711,631
Global Operations(a) ............. 5,515 1,503,622 9,172 69,764 67,661 1,012,597
Corporate and eliminations(b) ..... — (1,514,289) (28,885) 14,181 29,067 (3,248,476)
Consolidated Total .............. $4,067,947 — 588,598 180,963 104,129 3,896,892
(a) The Global Operations segment derives substantially all of its revenues, and thus its operating results, from
intersegment activities.
(b) Certain intangible assets, primarily goodwill, which benefit multiple operating segments are reflected as
Corporate assets for segment reporting purposes. In accordance with accounting standards related to
impairment testing, these amounts have been allocated to the reporting unit which benefits from their use. In
addition, allocations of certain expenses related to these assets to the individual operating segments are done
at the beginning of the year based on budgeted amounts. Any differences between actual and budgeted
amounts are reflected in the Corporate segment.
82