Hasbro 2011 Annual Report Download - page 55
Download and view the complete annual report
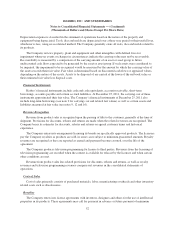
Please find page 55 of the 2011 Hasbro annual report below. You can navigate through the pages in the report by either clicking on the pages listed below, or by using the keyword search tool below to find specific information within the annual report.-
 1
1 -
2
-
3
-
4
-
5
-
6
-
7
-
8
-
9
-
10
-
11
-
12
-
13
-
14
-
15
-
16
-
17
-
18
-
19
-
20
-
21
-
22
-
23
-
24
-
25
-
26
-
27
-
28
-
29
-
30
-
31
-
32
-
33
-
34
-
35
-
36
-
37
-
38
-
39
-
40
-
41
-
42
-
43
-
44
-
 45
45 -
 46
46 -
 47
47 -
 48
48 -
 49
49 -
 50
50 -
 51
51 -
 52
52 -
 53
53 -
 54
54 -
 55
55 -
 56
56 -
 57
57 -
 58
58 -
 59
59 -
 60
60 -
 61
61 -
 62
62 -
 63
63 -
 64
64 -
 65
65 -
66
-
67
-
68
-
69
-
70
-
71
-
72
-
73
-
74
-
75
-
76
-
77
-
78
-
79
-
80
-
81
-
82
-
83
-
84
-
85
-
86
-
87
-
88
-
89
-
90
-
91
-
92
-
93
-
94
-
95
-
96
-
97
-
98
-
99
-
100
-
101
-
102
-
103
-
104
-
105
-
106
-
107
-
108
-
109
-
110
 |
 |

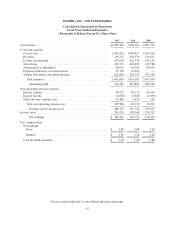
HASBRO, INC. AND SUBSIDIARIES
Consolidated Balance Sheets
December 25, 2011 and December 26, 2010
(Thousands of Dollars Except Share Data)
2011 2010
ASSETS
Current assets
Cash and cash equivalents ............................................. $ 641,688 727,796
Accounts receivable, less allowance for doubtful accounts
of $23,700 in 2011 and $31,200 in 2010 ................................ 1,034,580 961,252
Inventories ......................................................... 333,993 364,194
Prepaid expenses and other current assets ................................. 243,431 167,807
Total current assets ................................................. 2,253,692 2,221,049
Property, plant and equipment, net ......................................... 218,021 233,580
Other assets
Goodwill ........................................................... 474,792 474,813
Other intangibles, net ................................................. 467,293 500,597
Other .............................................................. 716,976 663,187
Total other assets .................................................. 1,659,061 1,638,597
Total assets ....................................................... $4,130,774 4,093,226
LIABILITIES AND SHAREHOLDERS’ EQUITY
Current liabilities
Short-term borrowings ................................................ $ 180,430 14,568
Accounts payable .................................................... 134,864 132,517
Accrued liabilities .................................................... 627,050 571,716
Total current liabilities .............................................. 942,344 718,801
Long-term debt ........................................................ 1,400,872 1,397,681
Other liabilities ........................................................ 370,043 361,324
Total liabilities .................................................... 2,713,259 2,477,806
Shareholders’ equity
Preference stock of $2.50 par value. Authorized 5,000,000 shares; none issued .... — —
Common stock of $0.50 par value. Authorized 600,000,000 shares; issued
209,694,630 shares in 2011 and 2010 .................................. 104,847 104,847
Additional paid-in capital .............................................. 630,044 625,961
Retained earnings .................................................... 3,205,420 2,978,317
Accumulated other comprehensive (loss) earnings .......................... (35,943) 8,149
Treasury stock, at cost, 81,061,373 shares in 2011 and 72,278,515 shares in
2010 ............................................................ (2,486,853) (2,101,854)
Total shareholders’ equity ........................................... 1,417,515 1,615,420
Total liabilities and shareholders’ equity ................................ $4,130,774 4,093,226
See accompanying notes to consolidated financial statements.
46