Hasbro 2011 Annual Report Download - page 56
Download and view the complete annual report
Please find page 56 of the 2011 Hasbro annual report below. You can navigate through the pages in the report by either clicking on the pages listed below, or by using the keyword search tool below to find specific information within the annual report.-
 1
1 -
2
-
3
-
4
-
5
-
6
-
7
-
8
-
9
-
10
-
11
-
12
-
13
-
14
-
15
-
16
-
17
-
18
-
19
-
20
-
21
-
22
-
23
-
24
-
25
-
26
-
27
-
28
-
29
-
30
-
31
-
32
-
33
-
34
-
35
-
36
-
37
-
38
-
39
-
40
-
41
-
42
-
43
-
44
-
45
-
 46
46 -
 47
47 -
 48
48 -
 49
49 -
 50
50 -
 51
51 -
 52
52 -
 53
53 -
 54
54 -
 55
55 -
 56
56 -
 57
57 -
 58
58 -
 59
59 -
 60
60 -
 61
61 -
 62
62 -
 63
63 -
 64
64 -
 65
65 -
 66
66 -
67
-
68
-
69
-
70
-
71
-
72
-
73
-
74
-
75
-
76
-
77
-
78
-
79
-
80
-
81
-
82
-
83
-
84
-
85
-
86
-
87
-
88
-
89
-
90
-
91
-
92
-
93
-
94
-
95
-
96
-
97
-
98
-
99
-
100
-
101
-
102
-
103
-
104
-
105
-
106
-
107
-
108
-
109
-
110
 |
 |

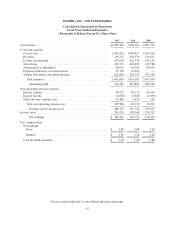
HASBRO, INC. AND SUBSIDIARIES
Consolidated Statements of Operations
Fiscal Years Ended in December
(Thousands of Dollars Except Per Share Data)
2011 2010 2009
Net revenues ................................................ $4,285,589 4,002,161 4,067,947
Costs and expenses
Cost of sales .............................................. 1,836,263 1,690,057 1,676,336
Royalties ................................................. 339,217 248,570 330,651
Product development ........................................ 197,638 201,358 181,195
Advertising ............................................... 413,951 420,651 412,580
Amortization of intangibles ................................... 46,647 50,405 85,029
Program production cost amortization .......................... 35,798 22,069 —
Selling, distribution and administration ......................... 822,094 781,192 793,558
Total expenses ........................................... 3,691,608 3,414,302 3,479,349
Operating profit ........................................ 593,981 587,859 588,598
Non-operating (income) expense
Interest expense ............................................ 89,022 82,112 61,603
Interest income ............................................ (6,834) (5,649) (2,858)
Other (income) expense, net .................................. 25,400 3,676 156
Total non-operating expense, net ............................ 107,588 80,139 58,901
Earnings before income taxes ............................. 486,393 507,720 529,697
Income taxes ................................................ 101,026 109,968 154,767
Net earnings ........................................... $ 385,367 397,752 374,930
Per common share
Net earnings
Basic .................................................. $ 2.88 2.86 2.69
Diluted ................................................. $ 2.82 2.74 2.48
Cash dividends declared ..................................... $ 1.20 1.00 0.80
See accompanying notes to consolidated financial statements.
47