Hasbro 2011 Annual Report Download - page 40
Download and view the complete annual report
Please find page 40 of the 2011 Hasbro annual report below. You can navigate through the pages in the report by either clicking on the pages listed below, or by using the keyword search tool below to find specific information within the annual report.-
 1
1 -
2
-
3
-
4
-
5
-
6
-
7
-
8
-
9
-
10
-
11
-
12
-
13
-
14
-
15
-
16
-
17
-
18
-
19
-
20
-
21
-
22
-
23
-
24
-
25
-
26
-
27
-
28
-
29
-
 30
30 -
 31
31 -
 32
32 -
 33
33 -
 34
34 -
 35
35 -
 36
36 -
 37
37 -
 38
38 -
 39
39 -
 40
40 -
 41
41 -
 42
42 -
 43
43 -
 44
44 -
 45
45 -
 46
46 -
 47
47 -
 48
48 -
 49
49 -
 50
50 -
51
-
52
-
53
-
54
-
55
-
56
-
57
-
58
-
59
-
60
-
61
-
62
-
63
-
64
-
65
-
66
-
67
-
68
-
69
-
70
-
71
-
72
-
73
-
74
-
75
-
76
-
77
-
78
-
79
-
80
-
81
-
82
-
83
-
84
-
85
-
86
-
87
-
88
-
89
-
90
-
91
-
92
-
93
-
94
-
95
-
96
-
97
-
98
-
99
-
100
-
101
-
102
-
103
-
104
-
105
-
106
-
107
-
108
-
109
-
110
 |
 |
category also decreased in 2010 due to decreased sales of traditional board games and puzzles in the U.S. late in
the year. These decreases were partially offset by increased sales of MAGIC: THE GATHERING trading card
games. Sales in the girls’ category were flat in 2010. Increased sales of FURREAL FRIENDS products and, to a
lesser extent, BABY ALIVE products were offset by decreased sales of MY LITTLE PONY and LITTLEST
PET SHOP products. Although revenues from LITTLEST PET SHOP products decreased in 2010, sales of these
products remained a significant contributor to U.S. and Canada segment net revenues. Net revenues in the
preschool category increased in 2010 as the result of stronger sales of PLAY-DOH, TONKA and PLAYSKOOL
products.
U.S. and Canada operating profit decreased to $349,594 in 2010 from $380,580 in 2009. Foreign currency
translation did not have a material impact on U.S. and Canada operating profit in 2010. The decrease in U.S. and
Canada operating profit was primarily driven by the decreased revenues in 2010 discussed above and, to a lesser
extent, higher cost of sales as a percentage of those revenues due to a change in the mix of products sold. These
decreases were partially offset by decreased royalty and amortization expense in 2010.
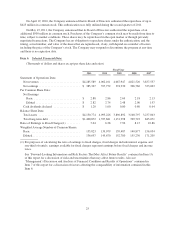
International
International segment net revenues for the year ended December 25, 2011 increased by 19% to $1,861,901
from $1,559,927 in 2010. In 2011, net revenues were positively impacted by currency translation of
approximately $59,300 as a result of a weaker U.S. dollar. Excluding the favorable impact of foreign exchange,
International segment net revenues increased 16% in local currency in 2011. Revenues increased in 2011 in all
major geographic regions as part of our ongoing strategy to achieve growth in the International segment. Net
revenues in both Europe and Latin America / Mexico each increased 19% in 2011 compared to 2010, while Asia
Pacific net revenues increased 24% in 2011 compared to 2010. The increased International segment net revenues
were driven by increased sales in the boys’ toys category. The increase in the boys’ toys category was primarily
due to the first full year of sales related to BEYBLADE products, which were reintroduced in 2010 as well as
higher sales of TRANSFORMERS, NERF, KRE-O and SUPER SOAKER products. Sales of TRANSFORMERS
and KRE-O products benefited from the theatrical release of TRANSFORMERS: DARK OF THE MOON during
2011. Increased sales in the boys’ toys category were slightly offset by decreased sales in the preschool, girls’
toys, and games and puzzles categories. Decreased sales of PLAYSKOOL and TONKA products in the
preschool category were partially offset by sales of SESAME STREET products. The decrease in net revenues in
the girls’ toys category is primarily due to decreased sales of LITTLEST PET SHOP products, which were
partially offset by increased sales of FURREAL FRIENDS and BABY ALIVE products. Net revenues in the
games and puzzles category decreased slightly as a result of lower sales of board games, partially offset by
increased sales of MAGIC: THE GATHERING products.
International segment operating profit increased 29% to $270,578, or 14.5% of net revenues, in 2011 from
$209,704, or 13.4% of net revenues, in 2010. Operating profit for the International segment in 2011 was
positively impacted by approximately $4,400 due to the translation of foreign currencies to the U.S. dollar. The
increase in operating profit was primarily driven by the increased net revenues described above. This was
partially offset by higher royalty expense as a result of increased revenues from higher royalty-bearing products,
particularly BEYBLADE and movie-related TRANSFORMERS products. The increase in operating profit
margin was largely due to the impact of the increased net revenues.
International segment net revenues for the year ended December 26, 2010 increased by 7% to $1,559,927
from $1,459,476 in 2009. In 2010, net revenues were negatively impacted by currency translation of
approximately $27,600 as a result of a stronger U.S. dollar. Excluding the unfavorable impact of foreign
exchange, International segment net revenues increased 9% in local currency in 2010. The increased net revenues
in 2010 were driven by increased sales in all categories as well as growth in emerging markets, including Brazil,
Russia and China. The increase in the boys’ toys category was primarily due to higher sales of NERF products as
well as the reintroduction of BEYBLADE products in 2010. Increased sales of MARVEL and TONKA products
also contributed to the increased sales in the boys’ toys category. These increases were partially offset by
decreases in the TRANSFORMERS and G.I. JOE lines. The increase in net revenues in the girls’ toys category
was primarily driven by increased sales of FURREAL FRIENDS products partially offset by lower sales of MY
31