Hasbro 2011 Annual Report Download - page 38
Download and view the complete annual report
Please find page 38 of the 2011 Hasbro annual report below. You can navigate through the pages in the report by either clicking on the pages listed below, or by using the keyword search tool below to find specific information within the annual report.-
 1
1 -
2
-
3
-
4
-
5
-
6
-
7
-
8
-
9
-
10
-
11
-
12
-
13
-
14
-
15
-
16
-
17
-
18
-
19
-
20
-
21
-
22
-
23
-
24
-
25
-
26
-
27
-
 28
28 -
 29
29 -
 30
30 -
 31
31 -
 32
32 -
 33
33 -
 34
34 -
 35
35 -
 36
36 -
 37
37 -
 38
38 -
 39
39 -
 40
40 -
 41
41 -
 42
42 -
 43
43 -
 44
44 -
 45
45 -
 46
46 -
 47
47 -
 48
48 -
49
-
50
-
51
-
52
-
53
-
54
-
55
-
56
-
57
-
58
-
59
-
60
-
61
-
62
-
63
-
64
-
65
-
66
-
67
-
68
-
69
-
70
-
71
-
72
-
73
-
74
-
75
-
76
-
77
-
78
-
79
-
80
-
81
-
82
-
83
-
84
-
85
-
86
-
87
-
88
-
89
-
90
-
91
-
92
-
93
-
94
-
95
-
96
-
97
-
98
-
99
-
100
-
101
-
102
-
103
-
104
-
105
-
106
-
107
-
108
-
109
-
110
 |
 |

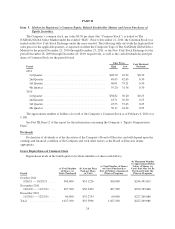
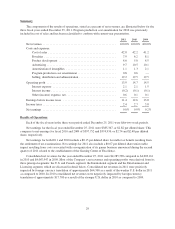
Summary
The components of the results of operations, stated as a percent of net revenues, are illustrated below for the
three fiscal years ended December 25, 2011. Program production cost amortization for 2010 was previously
included in cost of sales and has been reclassified to conform with current year presentation.
2011 2010 2009
Net revenues .................................................. 100.0% 100.0% 100.0%
Costs and expenses:
Cost of sales .............................................. 42.8 42.2 41.2
Royalties ................................................. 7.9 6.2 8.1
Product development ....................................... 4.6 5.0 4.5
Advertising ............................................... 9.7 10.5 10.1
Amortization of intangibles .................................. 1.1 1.3 2.1
Program production cost amortization .......................... 0.8 0.6 —
Selling, distribution and administration ......................... 19.2 19.5 19.5
Operating profit ............................................... 13.9 14.7 14.5
Interest expense ........................................... 2.1 2.1 1.5
Interest income ............................................ (0.2) (0.1) (0.1)
Other (income) expense, net .................................. 0.6 0.1 0.1
Earnings before income taxes .................................... 11.4 12.6 13.0
Income taxes .................................................. 2.4 2.7 3.8
Net earnings .................................................. 9.0% 9.9% 9.2%
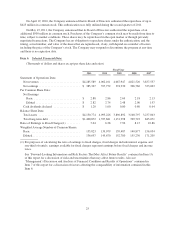
Results of Operations
Each of the fiscal years in the three-year period ended December 25, 2011 were fifty-two week periods.
Net earnings for the fiscal year ended December 25, 2011 were $385,367, or $2.82 per diluted share. This
compares to net earnings for fiscal 2010 and 2009 of $397,752 and $374,930, or $2.74 and $2.48 per diluted
share, respectively.
Net earnings for both 2011 and 2010 include a $0.15 per diluted share favorable tax benefit resulting from
the settlement of tax examinations. Net earnings for 2011 also include a $0.07 per diluted share unfavorable
impact resulting from costs associated with a reorganization of its games business announced during the second
quarter of 2011 related to the establishment of the Gaming Center of Excellence.
Consolidated net revenues for the year ended December 25, 2011 were $4,285,589 compared to $4,002,161
in 2010 and $4,067,947 in 2009. Most of the Company’s net revenues and operating profits were derived from its
three principal segments: the U.S. and Canada segment, the International segment and the Entertainment and
Licensing segment, which are discussed in detail below. Consolidated net revenues in 2011 were positively
impacted by foreign currency translation of approximately $64,300 as a result of the weaker U.S. dollar in 2011
as compared to 2010. In 2010 consolidated net revenues were negatively impacted by foreign currency
translation of approximately $17,700 as a result of the stronger U.S. dollar in 2010 as compared to 2009.
29