Hasbro 2011 Annual Report Download - page 41
Download and view the complete annual report
Please find page 41 of the 2011 Hasbro annual report below. You can navigate through the pages in the report by either clicking on the pages listed below, or by using the keyword search tool below to find specific information within the annual report.-
 1
1 -
2
-
3
-
4
-
5
-
6
-
7
-
8
-
9
-
10
-
11
-
12
-
13
-
14
-
15
-
16
-
17
-
18
-
19
-
20
-
21
-
22
-
23
-
24
-
25
-
26
-
27
-
28
-
29
-
30
-
 31
31 -
 32
32 -
 33
33 -
 34
34 -
 35
35 -
 36
36 -
 37
37 -
 38
38 -
 39
39 -
 40
40 -
 41
41 -
 42
42 -
 43
43 -
 44
44 -
 45
45 -
 46
46 -
 47
47 -
 48
48 -
 49
49 -
 50
50 -
 51
51 -
52
-
53
-
54
-
55
-
56
-
57
-
58
-
59
-
60
-
61
-
62
-
63
-
64
-
65
-
66
-
67
-
68
-
69
-
70
-
71
-
72
-
73
-
74
-
75
-
76
-
77
-
78
-
79
-
80
-
81
-
82
-
83
-
84
-
85
-
86
-
87
-
88
-
89
-
90
-
91
-
92
-
93
-
94
-
95
-
96
-
97
-
98
-
99
-
100
-
101
-
102
-
103
-
104
-
105
-
106
-
107
-
108
-
109
-
110
 |
 |

LITTLE PONY and LITTLEST PET SHOP products. Preschool category net revenues increased primarily as the
result of stronger sales of PLAY-DOH and PLAYSKOOL products offset by decreased sales of IN THE NIGHT
GARDEN products. Net revenues in the games and puzzles category increased slightly as a result of increased
revenues from MAGIC: THE GATHERING trading card games.
International segment operating profit increased 29% to $209,704 in 2010 from $162,159 in 2009.
Operating profit for the International segment in 2010 was negatively impacted by approximately $11,500 due to
the translation of foreign currencies to the U.S. dollar. The increase in operating profit was primarily driven by
the increased revenues described above. In addition, operating profit was positively impacted by decreased
royalty expense and amortization. These were offset by increased selling, distribution and administration
expenses.
Entertainment and Licensing
The Entertainment and Licensing segment’s net revenues for the year ended December 25, 2011 increased
19% to $162,233 from $136,488 for the year ended December 26, 2010. The increase was primarily due to
growth in television programming and lifestyle licensing revenues. The increased television programming
revenues reflect a full year of U.S. and international program distribution in 2011 compared to a partial period in
2010, as program distribution primarily commenced during the third quarter of 2010. Higher lifestyle licensing
revenues primarily related to TRANSFORMERS, as a result of licensing programs based on the motion picture
release in 2011.
Entertainment and Licensing segment operating profit decreased 1% to $42,784 in 2011 from $43,234 in
2010. The impact of higher net revenues was offset by investments made by the Company to grow its global
licensing organization and increased program production cost amortization.
The Entertainment and Licensing segment’s net revenues for the year ended December 26, 2010 decreased
12% to $136,488 from $155,013 for the year ended December 27, 2009. The decrease was primarily due to
decreases in both lifestyle and digital gaming licensing revenues, primarily relating to lower licensing revenues
from TRANSFORMERS and, to a lesser extent, G.I. JOE, products following the motion picture releases in
2009.
Entertainment and Licensing segment operating profit decreased 34% to $43,234 in 2010 from $65,572 in
2009. Operating profit decreased as a result of the decreased revenues discussed above and program production
amortization costs associated with our television shows. This was partially offset by lower selling, distribution
and administration expenses. Selling, distribution and administration expenses in 2009 included approximately
$7,200 in transaction costs related to the Company’s investment in THE HUB.
While THE HUB is a component of our television operations, the Company’s 50% share in the earnings
from the joint venture is included in other (income) expense and therefore is not a component of operating profit
of the segment.
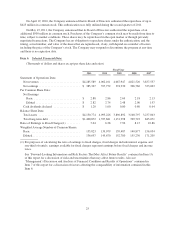
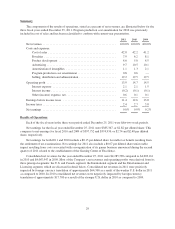
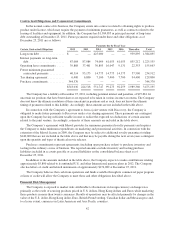
Expenses
The Company’s operating expenses, stated as percentages of net revenues, are illustrated below for the three
fiscal years ended December 25, 2011:
2011 2010 2009
Cost of sales ................................................... 42.8% 42.2% 41.2%
Royalties ...................................................... 7.9 6.2 8.1
Product development ............................................. 4.6 5.0 4.5
Advertising .................................................... 9.7 10.5 10.1
Amortization of intangibles ........................................ 1.1 1.3 2.1
Program production cost amortization ............................... 0.8 0.6 —
Selling, distribution and administration .............................. 19.2 19.5 19.5
32