GE 2011 Annual Report Download - page 98
Download and view the complete annual report
Please find page 98 of the 2011 GE annual report below. You can navigate through the pages in the report by either clicking on the pages listed below, or by using the keyword search tool below to find specific information within the annual report.-
 1
1 -
2
-
3
-
4
-
5
-
6
-
7
-
8
-
9
-
10
-
11
-
12
-
13
-
14
-
15
-
16
-
17
-
18
-
19
-
20
-
21
-
22
-
23
-
24
-
25
-
26
-
27
-
28
-
29
-
30
-
31
-
32
-
33
-
34
-
35
-
36
-
37
-
38
-
39
-
40
-
41
-
42
-
43
-
44
-
45
-
46
-
47
-
48
-
49
-
50
-
51
-
52
-
53
-
54
-
55
-
56
-
57
-
58
-
59
-
60
-
61
-
62
-
63
-
64
-
65
-
66
-
67
-
68
-
69
-
70
-
71
-
72
-
73
-
74
-
75
-
76
-
77
-
78
-
79
-
80
-
81
-
82
-
83
-
84
-
85
-
86
-
87
-
 88
88 -
 89
89 -
 90
90 -
 91
91 -
 92
92 -
 93
93 -
 94
94 -
 95
95 -
 96
96 -
 97
97 -
 98
98 -
 99
99 -
 100
100 -
 101
101 -
 102
102 -
 103
103 -
 104
104 -
 105
105 -
 106
106 -
 107
107 -
 108
108 -
109
-
110
-
111
-
112
-
113
-
114
-
115
-
116
-
117
-
118
-
119
-
120
-
121
-
122
-
123
-
124
-
125
-
126
-
127
-
128
-
129
-
130
-
131
-
132
-
133
-
134
-
135
-
136
-
137
-
138
-
139
-
140
-
141
-
142
-
143
-
144
-
145
-
146
 |
 |

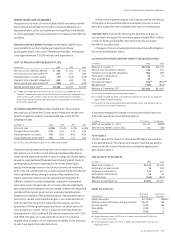
96 GE 2011 ANNUAL REPORT
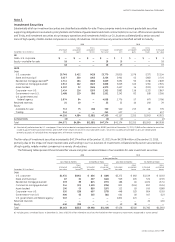
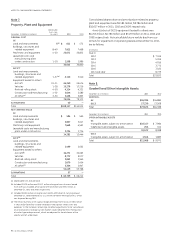
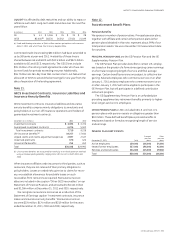
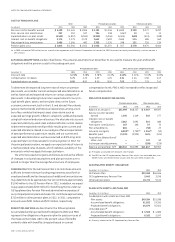
Note 7.
Property, Plant and Equipment
December 31 (Dollars in millions)
Depreciable
lives—new
(in years) 2011 2010
ORIGINAL COST
GE
Land and improvements 8 (a) $ 611 $ 573
Buildings, structures and
related equipment 8–40 7,823 7,468
Machinery and equipment 4–20 22,071 20,833
Leasehold costs and
manufacturing plant
under construction 1–10 2,538 1,986
33,043 30,860
GECS (b)
Land and improvements,
buildings, structures and
related equipment 1–37 (a) 3,110 3,510
Equipment leased to others
Aircraft 19–21 46,240 45,674
Vehicles 1–28 15,278 17,216
Railroad rolling stock 4–50 4,324 4,331
Construction and manufacturing 1–30 2,644 2,586
All other (c) 3–30 3,438 5,855
75,034 79,172
ELIMINATIONS 40 —
Total $108,117 $110,032
NET CARRYING VALUE
GE
Land and improvements $ 584 $ 550
Buildings, structures and
related equipment 3,827 3,617
Machinery and equipment 7,648 6,551
Leasehold costs and manufacturing
plant under construction 2,224 1,726
14,283 12,444
GECS (b)
Land and improvements,
buildings, structures and
related equipment 1,499 1,665
Equipment leased to others
Aircraft (d) 34,271 34,665
Vehicles 8,772 9,077
Railroad rolling stock 2,853 2,960
Construction and manufacturing 1,670 1,454
All other (c) 2,354 3,947
51,419 53,768
ELIMINATIONS 37 —
Total $ 65,739 $ 66,212
(a) Depreciable lives exclude land.
(b) Included $1,570 million and $1,571 million of original cost of assets leased
to GE with accumulated amortization of $470 million and $531 million at
December 31, 2011 and 2010, respectively.
(c) Included $2,404 million of original cost and $1,670 million of carrying value at
December 31, 2010 related to our CLL marine container leasing business, which
was disposed during 2011.
(d) The GECAS business of GE Capital recognized impairment losses of $301 million
in 2011 and $438 million in 2010 recorded in the caption “Other costs and
expenses” in the Statement of Earnings to reflect adjustments to fair value based
on an evaluation of average current market values (obtained from third parties)
of similar type and age aircraft, which are adjusted for the attributes of the
specific aircraft under lease.
Consolidated depreciation and amortization related to property,
plant and equipment was $9,185 million, $9,786 million and
$10,617 million in 2011, 2010 and 2009, respectively.
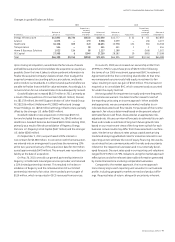
Amortization of GECS equipment leased to others was
$6,253 million, $6,786 million and $7,179 million in 2011, 2010 and
2009, respectively. Noncancellable future rentals due from cus-
tomers for equipment on operating leases at December 31, 2011,
are as follows:
(In millions)
Due in
2012 $ 7,345
2013 5,995
2014 4,916
2015 3,772
2016 3,025
2017 and later 8,779
Total $33,832
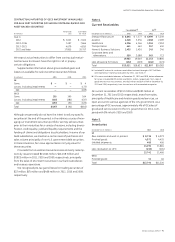
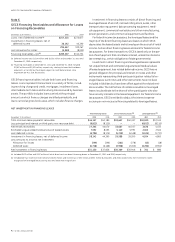
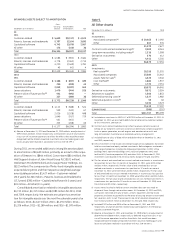
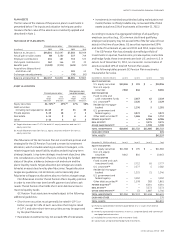
Note 8.
Goodwill and Other Intangible Assets
December 31 (In millions) 2011 2010
GOODWILL
GE $45,395 $36,880
GECS 27,230 27,508
Total $72,625 $64,388
December 31 (In millions) 2011 2010
OTHER INTANGIBLE ASSETS
GE
Intangible assets subject to amortization $10,317 $ 7,984
Indefinite-lived intangible assets 205 104
10,522 8,088
GECS
Intangible assets subject to amortization 1,546 1,883
Total $12,068 $ 9,971